


HALIFAX, NS / ACCESS Newswire / January 20, 2026 / Silver Tiger Metals Inc. (TSXV:SLVR) and (OTCQX:SLVTF) ("Silver Tiger" or the "Corporation") is pleased to announce the results of a Preliminary Economic Assessment ("PEA") on the underground at El Tigre and an updated Pre-Feasibility Study ("PFS") on the Stockwork Zone for its 100% owned, silver-gold El Tigre Project (the "Project" or "El Tigre") located in Sonora, Mexico. The bolt-on PEA is centred on the underground mining economics of the high-grade El Tigre, Sulphide, Black Shale and Seitz Kelly zones. The underground PEA and updated PFS is based on new consensus economics metal prices of $38 per ounce silver and $3,200 per ounce gold. The PEA mine design can be constructed independently of the Stockwork Zone development and is focused on the underground Mineral Resource. Prospective areas exist outside of the areas defined by the PEA and PFS with the historic "El Tigre North Mine" Mineral Resource located 700 metres to the North (see Exploration Potential section below).
Highlights of the PEA , with a base case silver price of $38/oz and gold price of $3,200/oz are as follows (all figures in US dollars unless otherwise stated):
After-Tax net present value ("NPV") (using a discount rate of 5%) of $304 million with an After-Tax IRR of 42.8% and Payback Period of 2.6 years (Base Case);
15-year UG mine life with 3-year historical tailings processing recovering a total of 38 million payable silver equivalent ounces ("AgEq") or 453 thousand gold equivalent ounces ("AuEq"), consisting of 34 million silver ounces and 130 thousand gold ounces;
Total Project undiscounted after-tax cash flow of $496 million;
Initial capital costs of $83.5 million, including $10.9 million in contingency costs, over an expected 18-month build, and sustaining capital costs of $213 million over the life of mine ("LOM");
The 2026 PEA mine plan is designed as stand-alone to the PFS, with a potential overlap of initial capital cost of $17M (e.g., grid power, offices);
Average LOM operating cash costs of $1,351/oz AuEq, and all in sustaining costs ("AISC") of $2,019/oz AuEq or Average LOM operating cash costs of $16.05/oz AgEq, and AISC of $23.98/oz AgEq;
Average annual production of approximately 2.3 million AgEq oz or 27.8 thousand AuEq oz, consisting of 2.1 million silver ounces and 8.0 thousand gold ounces (refer to Table 10 footnotes for conversion to Eq ozs); and
PEA Study of the Southern Veins does not include the 38 million ounces AgEq contained in the Northern Veins (see details in updated Mineral Resource Estimate below).
Highlights of the updated PFS , with new base case silver price of $38/oz and gold price of $3,200/oz are as follows (all figures in US dollars unless otherwise stated):
After-Tax net present value ("NPV") (using a discount rate of 5%) of $456 million with an After-Tax IRR of 65.7% and Payback Period of 1.4 years;
10-year mine life recovering a total of 43 million payable silver equivalent ounces ("AgEq") or 509 thousand payable gold equivalent ounces ("AuEq"), consisting of 9 million silver ounces and 408 thousand gold ounces;
Total Project undiscounted after-tax cash flow of $625 million;
Initial capital costs of $86.8 million, which includes $9.3 million of contingency costs, over an expected 18-month build, expansion capital of $20.1 million in year 3 and sustaining capital costs of $6.2 million over the life of mine ("LOM");
Average LOM operating cash costs of $997/oz AuEq, and all in sustaining costs ("AISC") of $1,238/oz AuEq or Average LOM operating costs of $11.7/oz AgEq, and all in sustaining costs ("AISC") of $14.5/oz AgEq;
Average annual production of approximately 4.8 million AgEq oz or 56.5 thousand AuEq oz; and
Three (3) years of production in the Proven category in the Phase 1 Starter Pit with 60% of overall final pit Mineral Reserve in Proven category.
Glenn Jessome, President and CEO, stated "This updated PFS for the Stockwork Zone and initial PEA for the underground provide the first look at the combined economics of El Tigre. At current spot silver and gold prices, the Stockwork Zone Project generates an after-tax NPV of approximately $950 million US dollars and the underground project generates an after-tax NPV of approximately $1.20 billion US dollars at a discount rate of 5%. At current spot silver and gold prices, the Stockwork Zone Project generates approximately $1.30 billion US dollars of net cashflow after tax over life of mine and the underground project generates approximately $1.85 billion US dollars of net cashflow after tax over life of mine." Mr. Jessome further stated, "In the backdrop of all-time high silver and gold prices we are completing detailed engineering and proceeding to build the Stockwork Zone Project." Mr. Jessome continued, "The underground at El Tigre is a standalone bolt-on project and we intend to complete development for this low capex underground project and advance towards production as quickly as possible."
Underground Preliminary Economic Assessment Summary
The PEA was prepared by independent consultants P&E Mining Consultants Inc. ("P&E"), with metallurgical test work completed by SGS Lakefield, geotechnical work by WSP Canada Ltd., process plant design and costing by D.E.N.M. Engineering Ltd., and environmental and permitting led by CIMA Mexico.
The 2026 PEA underground mine and mineral processing plan is scheduled over a production period of ~17 years. The mine plan portion of the Mineral Resource Estimate for the El Tigre 2026 PEA totals 5.0 Mt at average grades of 331.7 g/t AgEq, 251.3 g/t Ag, 0.91 g/t Au, 0.03% Cu, 0.10% Pb and 0.17% Zn (base metals provide no economic benefit under the proposed cyanidation process). Approximately 85% of the mine plan portion of the Mineral Resource, including historical tailings and low-grade stockpile mineralization, is classified as Measured and Indicated.
Following are tables and figures showing key assumptions, results, and sensitivities.
Figure 1: El Tigre -UG PEA Stopes and Development by Zone (Southern Veins)

Table 1: El Tigre UG PEA Key Economic Assumptions and Results
Assumption / Result | Unit | Value | Assumption / Result | Unit | Value |
|---|---|---|---|---|---|
Plant Feed Processed | kt | 5,023 | Net Revenue | US$M | 1,665.4 |
Waste Rock Mined | kt | 2,439 | Initial Capital | US$M | 83.5 |
Silver Grade | g/t | 251.3 | Sustaining Capital | US$M | 213.6 |
Gold Grade | g/t | 0.91 | Mining and Haulage Costs | $/t processed | 62.49 |
Silver Recovery (UG) | % | 84 | Processing Costs (UG and Stockpile) | $/t processed | 41.55 / 24.25 |
Gold Recovery (UG) | % | 90 | G&A Costs | $/t processed | 18.71 |
Silver Price | US$/oz | 38.00 | Operating Cash Cost | US$/oz AgEq | 16.0 |
Gold Price | US$/oz | 3,200 | All-in Sustaining Cost | US$/oz AgEq | 24.0 |
Payable Silver Metal | Moz | 33.6 | After-Tax NPV (5% discount) | US$M | 304.0 |
Payable Gold Metal | koz | 130 | Pre-Tax NPV (5% discount) | US$M | 487.3 |
Payable AgEq | Moz | 38.5 | After-Tax IRR | % | 42.8 |
Production and Reclamation | years | 18 | Pre-Tax IRR | % | 65.2 |
Average Feed Processed | tpd | 800 | After-Tax Payback Period | years | 2.6 |
Figure 2 : El Tigre UG PEA Cash Flow Profile by Year
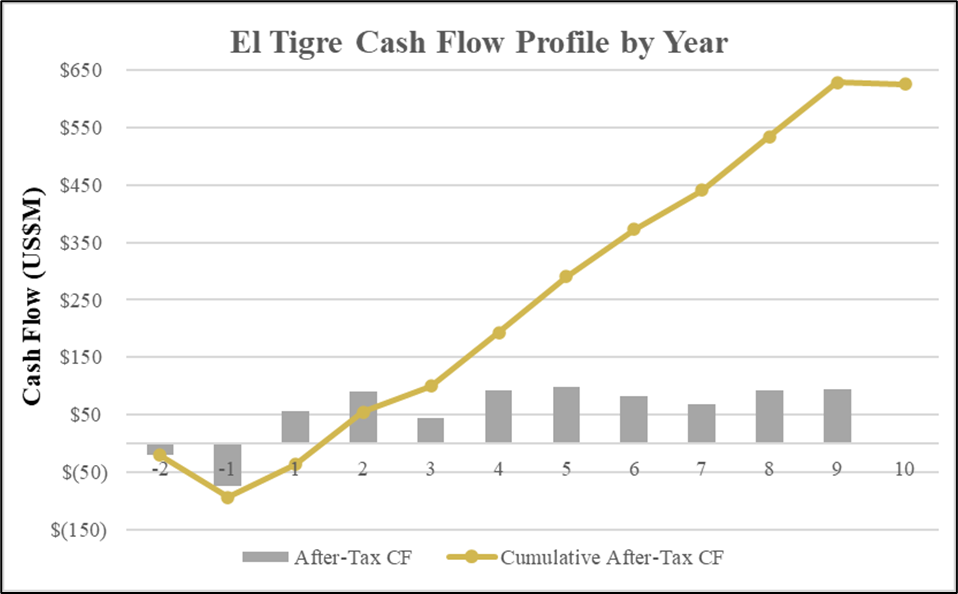
Figure 2 above highlights the after-tax cash flows of $496 million associated with the UG component of the Project. The economics of the Project have been evaluated based on the base case scenario $38/oz silver price, and gold price of $3,200/oz. As illustrated in the following sensitivity tables, the Project remains robust even at lower commodity prices or with higher costs.
Table 2: El Tigre PEA Gold and Silver Price Sensitivities
Sensitivity | -20% | -10% | Base Case | +10% | +20% |
|---|---|---|---|---|---|
Silver Price (US$/oz) | 30 | 34 | 38 | 42 | 46 |
Gold Price (US$/oz) | 2,560 | 2,880 | 3,200 | 3,520 | 3,840 |
After-Tax NPV (5%) (US$M) | 153.9 | 229.1 | 304.0 | 378.9 | 453.9 |
After-Tax IRR (%) | 24.8 | 33.8 | 42.8 | 51.8 | 61.0 |
After-Tax Payback (years) | 3.5 | 3.0 | 2.6 | 2.2 | 1.9 |
Table 3: El Tigre PEA Operating Cost and Capital Cost Sensitivities
Sensitivity | -20% | -10% | Base Case | +10% | +20% |
|---|---|---|---|---|---|
Operating Costs - NPV 5 (US$M) | 354.9 | 329.5 | 304.0 | 278.6 | 253.2 |
Operating Costs - IRR (%) | 48.2 | 45.5 | 42.8 | 40.1 | 37.4 |
Capital Costs - NPV 5 (US$M) | 337.1 | 320.6 | 304.0 | 287.5 | 271.0 |
Capital Costs - IRR (%) | 55.1 | 48.4 | 42.8 | 38.1 | 34.0 |
Capital and Operating Costs
Capital and Operating costs are listed in Table 4 below. The El Tigre Underground Project has been envisioned as an independent underground operation at a processing rate of 800 tonnes per day with a mine lifeof15 years. Before full UG production, historical stockpile material (119 kt @176 g/t Ag and 0.85 g/t Au) is processed in Year-1. After UG production is complete in Year 15, historical tailings (904 kt @ 77.6 g/t Ag and 0.27 g/t Au) will be processed for an additional three years.
If the 2026 PEA mine plan was to be implemented after mining commenced as detailed in the PFS sections of the Technical Report, there would be a potential savings in PEA initial capital costs of approximately $17.0M. The savings would consist of infrastructure such as the electrical powerline for grid power, and camp and office facilities, plus much of the owner's costs.
Water supply to the process plant is provided by pumping nearby water from dewatering wells to the process area water distribution system, and high voltage grid power will be installed by the local utility to supply process and infrastructure electrical requirements.
Table 4: LOM Capital Cost Estimate
2026 PEA Capital Cost Summary | |||
Item | Initial | Sustaining | Total |
($k) | ($k) | ($k) | |
Process Plant Directs | 22,298 | - | 22,298 |
Process Plant Indirects | 8,811 | - | 8,811 |
Underground Mining | 49,518 | 173,508 | 223,026 |
Infrastructure | 6,449 | - | 6,449 |
Dry Stack Tailings | 3,978 | 12,230 | 16,208 |
Owner's Costs | 10,743 | - | 10,743 |
Pre-production revenues | (29,175) | - | (29,175) |
Subtotal | 72,622 | 185,738 | 258,360 |
Contingencies @ 15% | 10,893 | 27,861 | 38,754 |
Total | 83,515 | 213,599 | 297,114 |
Mining
The El Tigre Underground Project is planned as a contractor-operated longhole mining operation with cemented paste backfill supplemented by minor mechanized cut and fill mining and recovery of existing low grade and tailings stockpiles. Underground mining contributes approximately 4,000 kt of mineralized material, with 119 kt from an historical low grade stockpile and 904 kt from an historical tailings stockpile, for a total of 5,022.8 kt grading over the LOM on average 331.7 g/t AgEq, 251.3 g/t Ag, 0.91 g/t Au, 0.033% Cu, 0.099% Pb and 0.166% Zn; base metals provide no economic benefit under the cyanidation process. Underground production is scheduled at 290 kt per annum ("ktpa"), giving an underground mine life of approximately 15 years and an overall Project life of approximately 18 years. Process plant commissioning with low grade stockpile material is planned in Year -1, and processing of historical tailings stockpile at 365 ktpa is scheduled for three years after underground mining is depleted.
Metallurgy
A metallurgical test program was carried out by SGS Lakefield of Ontario, Canada. The program included grinding and flotation work. The samples comprised of drill core sampling rejects representing the various zones of the Mineral Resource. This test program estimated average gold and silver respective hardrock metallurgical recoveries of 84.4% and 89.7% for silver and gold respectively. While base metals were recoverable, it was determined that the mined value of copper, lead and zinc does not justify the recovery cost of their respective metallurgical circuits.
Stockwork Zone Updated Pre-Feasibility Study Summary
The updated PFS used higher metal prices than the 2024 PFS (see release dated Oct 22, 2024) and was prepared by independent consultants P&E Mining Consultants Inc. ("P&E"), with metallurgical test work completed by McClelland Laboratories, Inc., Sparks, Nevada, process plant design and costing by D.E.N.M. Engineering Ltd., environmental and permitting led by CIMA Mexico and geotechnical design by WSP Canada Ltd.
The base case LOM is scheduled over a period of ten years (one year of preproduction and nine production years). The Proven and Probable Mineral Reserve Estimate for the El Tigre Project totals 40.3 Mt at average grades of 0.40 g/t Au and 14.9 g/t Ag. Approximately 60% of the Mineral Reserve is classified as Proven.
Surface mining will be initiated in Year -1 (pre-stripping period) and will be completed in Year 9. The initial ore heap leaching rate (Years 1 to 3) is 7,500 tpd (2.74 Mta). In Year 4 the crushing rate will increase to 15,000 tpd (5.5 Mtpa) and this rate is maintained to the end of the mine life. The El Tigre Mine is planned to be a contract mining operation. Over the LOM, 68.3 Mt of waste rock will be mined, with 40.3 Mt ore, for a total of 108.6 Mt at a strip ratio of 1.7:1.
After-Tax net present value ("NPV") (using a discount rate of 5%) of $456 million with an After-Tax IRR of 65.7% and Payback Period of 1.4 years over 10-year mine life recovering a total of 43 million payable silver equivalent ounces ("AgEq") or 509 thousand payable gold equivalent ounces ("AuEq"), consisting of 9 million silver ounces and 408 thousand gold ounces. Total Project undiscounted after-tax cash flow of $625 million with initial capital costs of $86.8 million, which includes $9.3 million of contingency costs, over an expected 18-month build. An expansion capital allocation of $20.1 million is planned in year 3 with sustaining capital costs of $6.2 million over the life of mine ("LOM"). Following are tables and figures showing key assumptions, results, and sensitivities.
Table 5: El Tigre PFS Key Economic Assumptions and Results (1-2)
Assumption / Result | Unit | Value | Assumption / Result | Unit | Value | |
|---|---|---|---|---|---|---|
Total OP Plant Feed Mined | kt | 40,292 | Net Revenue | US$M | 1,623.9 | |
Operating Strip Ratio | Ratio | 1.7:1 | Initial Capital Costs | US$M | 86.8 | |
Silver Grade1 | g/t | 14.9 | Expansion Capital Costs | US$M | 20.1 | |
Gold Grade1 | g/t | 0.40 | Sustaining Capital Costs | US$M | 6.2 | |
Silver Recovery (Oxide/Sul.)2 | % | 45 / 40 | Mining Costs | $/t Material | 2.24 | |
Gold Recovery (Oxide/Sul.)2 | % | 83 / 56 | Processing Costs (Phase 1 and Phase 2) | $/t Feed | 5.79/4.74 | |
Silver Price | US$/oz | 38.00 | G&A Costs | $/t Feed | 1.27 | |
Gold Price | US$/oz | 3,200 | Operating Cash Cost | US$/oz AgEq | 11.7 | |
Payable Silver Metal | Moz | 8.57 | All-in Sustaining Cost | US$/oz AgEq | 14.5 | |
Payable Gold Metal | koz | 408 | After-Tax NPV (5% discount) | US$M | 455.6 | |
Payable AgEq | Moz | 42.9 | Pre-Tax NPV (5% discount) | US$M | 737.2 | |
Mine Life | Yrs | 10 | After-Tax IRR | % | 65.7 | |
Average mining rate | t/day | 30,000 | Pre-Tax IRR | % | 87.7 | |
After-Tax Payback Period | Yrs | 1.4 |
Grades shown are LOM average process plant feed grades include only OP sources. Mining losses and external dilution of 3.7% were incorporated in the mining schedule.
Column testing indicated both variable gold and silver recovery for the oxide material vs the previously reported non-discounted PEA (83% and 64%) at a 3/8-in crush size. In the process design and financial model for the PFS process design and financial model recoveries have been discounted by 3% for leaching in the field versus optimum conditions in the laboratory and shown accordingly. The presence of transition and sulphide zones has affected both the gold and silver recoveries and are shown as separate recoveries. These are reasonable and appropriate for use in this PFS design and economic analysis.
Figure 3: PFS El Tigre Cash Flow Profile by Year

Figure 3 above highlights the after-tax cash flows of $625 million associated with the El Tigre Project. The economics of the Project have been evaluated based on the base case scenario $38/oz silver price and gold price of $3,200/oz. As illustrated in the following sensitivity tables, the Project remains robust even at lower commodity prices or with higher costs.
Table 6: El Tigre PFS Gold and Silver Price Sensitivities
Sensitivity | -20% | -10% | Base Case | +10% | +20% |
|---|---|---|---|---|---|
Silver Price (US$/oz) | 30 | 34 | 38 | 42 | 46 |
Gold Price (US$/oz) | 2,560 | 2,880 | 3,200 | 3,520 | 3,840 |
After-Tax NPV (5%) (US$M) | 303.9 | 379.8 | 455.6 | 531.5 | 607.4 |
After-Tax IRR (%) | 49.9 | 58.1 | 65.7 | 73.0 | 79.9 |
After-Tax Payback (years) | 1.7 | 1.5 | 1.4 | 1.3 | 1.2 |
Table 7: El Tigre PFS Operating Cost and Capital Cost Sensitivities
Sensitivity | -20% | -10% | Base Case | +10% | +20% |
|---|---|---|---|---|---|
Operating Costs - NPV 5 (US$M) | 502.0 | 478.8 | 455.6 | 432.5 | 409.3 |
Operating Costs - IRR (%) | 70.7 | 68.2 | 65.7 | 63.2 | 60.6 |
Capital Costs - NPV 5 (US$M) | 470.2 | 462.9 | 455.6 | 448.3 | 441.0 |
Capital Costs - IRR (%) | 77.7 | 71.2 | 65.7 | 61.1 | 57.0 |
Capital and Operating Costs
The El Tigre Project has been envisioned starting at a processing rate of 7,500 tonnes per day for years 1-3 and then 15,000 tonnes per day by year 4 after 1.5 years of construction for ramp up in year 3.
The process plant is comprised of conventional three (3) stage crushing to an optimum -3/8 inch (10 mm) crush size. The crushed material will be conveyed and loaded on the lined pad areas. A series of pumping and piping will allow irrigation of the stacked heap material and subsequent production of pregnant solution to flow to the respective impoundment pond. The pregnant solution will be pumped to the recovery facility consisting of the Merrill - Crowe process (zinc precipitation) and refinery to produce the gold and silver dore for marketing. The process barren solution will be recycled (with NaCN addition) and pumped back to the heap for further leaching. The process plant location will be adjacent to the pad and pond infrastructure area.
Water will be supplied from dewatering wells. Power to the El Tigre Property will be supplied by the national grid via a 72 km 34.5 kV overhead power line. The routing of the power line will be from Nacozari de Garcia. Overhead power lines will connect 13.8 kV, three phase and 60 Hz via a sub-station located near the process plant area. Expansion capital includes the cost to increase the process plant capacity from 7,500 tonnes per day to 15,000 tonnes per day as noted in Year 4 of operation.
Life of Mine (LOM) capital costing is listed below in Table 8, indicating Initial, Expansion and Sustaining Capital:
Table 8: LOM Capital Cost Estimate
Type | Initial | Expansion | Sustaining | Total |
(US$k) | (US$k) | (US$k) | (US$k) | |
Process Plant direct costs | 42,851 | 13,584 | 1,600 | 58,034 |
Mining direct costs | 2,660 | 4,362 | 3,956 | 10,978 |
Pre-stripping | 3,362 | 3,362 | ||
Infrastructure | 20,489 | 20,489 | ||
Process indirect costs (with EPCM) | 8,121 | 8,121 | ||
Total | 77,483 | 17,946 | 5,556 | 100,985 |
Contingency (12%) | 9,298 | 2,199 | 622 | 12,118 |
Total with Contingency | 86,780 | 20,145 | 6,178 | 113,103 |
Mining
The El Tigre Mine is planned to be a contract-operated mine. The Mining Contractor will undertake all drilling, loading, hauling, and mine site maintenance activities. A separate Blasting Contractor will provide blast hole loading, charging and detonating services using an ammonium nitrate fuel oil mixture. The Owner will provide overall mine management and technical services, such as mine planning, grade control, geotechnical, and surveying services. It is expected that mid-sized diesel hydraulic excavators and diesel-powered front-end loaders will be used. The anticipated truck size is 91 tonnes, similar to the CAT 777 truck, although alternate truck sizes may eventually be used.
Metallurgy
A detailed metallurgical test program was carried out by McClelland Laboratories, Inc., Sparks, Nevada on six (6) El Tigre starter pit samples. The program included crushing, coarse bottle rolls, and column testing at both 80% passing 3/8 inch and 1/2 inch (10 and 12 mm) crush size for five (5) of the six samples. One low grade sample was only crushed to 80% passing 1-1/2 inch (38 mm) as an indication of low grade leachability. The leach samples comprised of drill core sample representing the starter pit and during the testing process it became apparent that the presence of transition and sulphide zones are in the starter pit thus affecting the base design recoveries. This variable test program (column and coarse bottle roll) estimated oxide average gold and silver respective metallurgical recoveries of 86% Au and 48% Ag at the 3/8 inch (10 mm) crush. The transition and sulfide zones had estimated recoveries of 59% Au and 43% Ag. Further percolation testing also confirmed no requirement for agglomeration of the crushed material is required prior to loading on the leach pad.
Mineral Reserves
The Mineral Reserves are summarized in Table 9. Note that 85% of Total Probable and Proven tonnes are contained within Oxide material (15% in Sulphide or Transition) with 83% gold recovery.
The Mineral Reserves are the portion of the Mineral Resource that has been deemed economically mineable by the surface mining production plan. The Mineral Reserves consist only of Mineral Resources classified as Measured or Indicated converted to Proven and Probable. Inferred Mineral Resources are considered as waste in the PFS.
Table 9: PFS Mineral Reserves Summary (1-7)
Classification | Ore Tonnes | Au | Ag | AuEq | AgEq | Contained Au | Contained Ag |
(k) | (g/t) | (g/t) | (g/t) | (g/t) | (koz) | (koz) | |
Proven | |||||||
Oxide | 19,564 | 0.4 | 16.4 | 0.5 | 83.4 | 252 | 10,316 |
Sulphide | 4,655 | 0.52 | 7.6 | 0.58 | 65.2 | 78 | 1,137 |
Total Proven | 24,220 | 0.43 | 14.7 | 0.52 | 79.9 | 329 | 11,453 |
Probable | |||||||
Oxide | 14,800 | 0.37 | 13.7 | 0.45 | 74.3 | 176 | 6,519 |
Sulphide | 1,272 | 0.43 | 33.8 | 0.73 | 82.1 | 18 | 1,382 |
Total Probable | 16,073 | 0.37 | 15.3 | 0.47 | 74.9 | 194 | 7,901 |
Proven and Probable | |||||||
Oxide | 34,365 | 0.39 | 15.2 | 0.48 | 79.5 | 428 | 16,834 |
Sulphide | 5,928 | 0.5 | 13.2 | 0.61 | 68.8 | 95 | 2,520 |
Total 2P | 40,292 | 0.4 | 14.9 | 0.5 | 77.9 | 523 | 19,354 |
The Mineral Reserve estimate was prepared in accordance with 2014 CIM Definition Standards by Andrew Bradfield, P.Eng.
The effective date of the Mineral Reserve is October 22, 2024.
Au price of US$1,900/oz and Ag price of US$23/oz are assumed.
The Mineral Reserves are based on the surface mine production schedule.
Mineral Reserves include a combined ore loss and dilution of 2.9%.
Oxide and Sulphide Mineral Reserves are reported using a cut-off grade of 0.11 g/t AuEq and 0.16 g/t AuEq, respectively. Ore and waste rock mining cost of $2.60/t was assumed, with a process cost of $4.33/t (assumes 15,000 tpd production), G&A cost of $1.00/t, a royalty of 0.5% of revenue, and pit slopes ranging from 46 to 49 degrees. Heap leach recoveries were Oxide 83% Au and 40% Ag, Sulphide 56% Au and 40% Ag.
Rounding of some figures may lead to minor discrepancies in total.
Mineral Resource Estimate Summary
The basis for the PFS is the Mineral Resource Estimate completed by P&E for the El Tigre Project located in Sonora State, Mexico, which has an effective date of June 20, 2025. Changes over the previous 2024 MRE, are due to 1) change in cut- off grade, 2) additional drilling completed on the underground Mineral Resource, 3) extensive relogging was completed to improve confidence in UG and 4) more selective modeling was utilized in high-grade veins. A summary of the Mineral Resource Estimate is provided in Table 10 below.
Mineral Resource Estimate Highlights
113% Increase in Grade of Out-of-Pit M&I Resource (543 g/t AgEq vs 255) over 2024 MRE
6% Increase in Contained Ounces M&I Resources (314 Moz AgEq vs 283) for a higher grade, more refined underground model
25% Increase in Contained Ounces of In-Pit M&I Resource (190 Moz AgEq vs 152 Moz AgEq) over 2024 MRE due to cutoff changes
Table 10: Mineral Resource Estimate (1-14)
Classification | Cut-off AuEq (g/t) | Tonnes (k) | Ag (g/t) | Ag (koz) | Au (g/t) | Au (koz) | Cu (%) | Pb (%) | Zn (%) | AgEq (g/t) | AgEq (koz) | AuEq (g/t) | AuEq (koz) |
|---|---|---|---|---|---|---|---|---|---|---|---|---|---|
Pit-Constrained Oxide | |||||||||||||
Measured | 0.08 | 27,732 | 39 | 35,034 | 0.54 | 609 | NA | NA | NA | 136 | 120,923 | 0.78 | 693 |
Indicated | 0.08 | 19,804 | 10 | 6,593 | 0.36 | 75 | NA | NA | NA | 74 | 46,979 | 0.42 | 266 |
Meas + Ind | 0.08 | 47,536 | 27 | 41,626 | 0.46 | 709 | NA | NA | NA | 110 | 167,902 | 0.63 | 959 |
Inferred | 0.08 | 4,475 | 10 | 1,453 | 0.38 | 18 | NA | NA | NA | 77 | 11,045 | 0.44 | 63 |
Pit-Constrained Sulphide | |||||||||||||
Measured | 0.12 | 6,031 | 31 | 6,042 | 0.54 | 105 | NA | NA | NA | 96 | 18,667 | 0.79 | 154 |
Indicated | 0.12 | 1,723 | 14 | 756 | 0.46 | 25 | NA | NA | NA | 69 | 3,817 | 0.57 | 32 |
Meas + Ind | 0.12 | 7,755 | 27 | 6,798 | 0.52 | 131 | NA | NA | NA | 90 | 22,484 | 0.74 | 185 |
Inferred | 0.12 | 463 | 74 | 1,096 | 0.52 | 8 | NA | NA | NA | 136 | 2,034 | 1.11 | 17 |
Pit-Constrained Total | |||||||||||||
Measured | 0.08/0.12 | 33,763 | 38 | 41,076 | 0.54 | 588 | NA | NA | NA | 129 | 139,590 | 0.78 | 846 |
Indicated | 0.08/0.12 | 21,528 | 11 | 7,348 | 0.36 | 252 | NA | NA | NA | 73 | 50,796 | 0.43 | 298 |
Meas + Ind | 0.08/0.12 | 55,291 | 27 | 48,425 | 0.47 | 840 | NA | NA | NA | 107 | 190,386 | 0.64 | 1,144 |
Inferred | 0.08/0.12 | 4,939 | 16 | 2,550 | 0.39 | 62 | NA | NA | NA | 82 | 13,078 | 0.50 | 79 |
Out-Of-Pit | |||||||||||||
Measured | 1.28 | 1,010 | 453 | 14,698 | 1.05 | 34 | 0.13 | 0.54 | 0.92 | 589 | 19,118 | 7.09 | 230 |
Indicated | 1.28 | 1,374 | 398 | 17,588 | 1.05 | 47 | 0.08 | 0.24 | 0.41 | 509 | 22,482 | 6.13 | 271 |
Meas + Ind | 1.28 | 2,384 | 421 | 32,286 | 1.05 | 81 | 0.10 | 0.37 | 0.63 | 543 | 41,600 | 6.54 | 501 |
Inferred | 1.28 | 4,100 | 294 | 38,822 | 1.58 | 208 | 0.32 | 0.75 | 0.89 | 497 | 65,556 | 6.01 | 792 |
Tailings | |||||||||||||
Measured | 0.45 | 146 | 79 | 371 | 0.29 | 1 | NA | NA | NA | 103 | 487 | 1.22 | 6 |
Indicated | 0.45 | 706 | 77 | 1,752 | 0.26 | 6 | NA | NA | NA | 99 | 2,252 | 1.17 | 27 |
Meas + Ind | 0.45 | 852 | 77 | 2,118 | 0.27 | 7 | NA | NA | NA | 202 | 2,739 | 1.18 | 32 |
Inferred | 0.45 | 52 | 81 | 134 | 0.27 | 1 | NA | NA | NA | 104 | 173 | 1.23 | 2 |
Stockpile | |||||||||||||
Measured | 0.46 | 0 | 0 | 0 | 0 | 0 | 0 | 0 | 0 | 0 | 0 | 0 | 0 |
Indicated | 0.46 | 101 | 181 | 586 | 0.92 | 3 | 0.02 | 0.23 | 0.10 | 256 | 826 | 3.17 | 10 |
Meas + Ind | 0.46 | 101 | 181 | 586 | 0.92 | 3 | 0.02 | 0.23 | 0.10 | 256 | 826 | 3.17 | 10 |
Inferred | 0.46 | 18 | 146 | 83 | 0.46 | 0.3 | 0.02 | 0.17 | 0.09 | 183 | 104 | 2.27 | 1 |
Total | |||||||||||||
Measured | NA | 34,920 | 50 | 56,145 | 0.55 | 623 | 0.13 | 0.54 | 0.92 | 142 | 159,193 | 0.96 | 1,082 |
Indicated | NA | 23,708 | 36 | 27,275 | 0.40 | 308 | 0.07 | 0.24 | 0.39 | 100 | 76,350 | 0.79 | 605 |
Meas + Ind | NA | 58,628 | 44 | 83,415 | 0.49 | 931 | 0.09 | 0.36 | 0.61 | 125 | 235,543 | 0.90 | 1,688 |
Inferred | NA | 9,108 | 142 | 41,589 | 0.92 | 271 | 0.32 | 0.75 | 0.89 | 269 | 78,911 | 2.99 | 874 |
Notes:
Mineral Resources, which are not Mineral Reserves, do not have demonstrated economic viability. The estimate of Mineral Resources may be materially affected by environmental, permitting, legal, title, taxation, socio-political, marketing, or other relevant issues.
The Inferred Mineral Resource in this estimate has a lower level of confidence than that applied to an Indicated Mineral Resource and must not be converted to a Mineral Reserve. It is reasonably expected that the majority of the Inferred Mineral Resource could be upgraded to an Indicated Mineral Resource with continued exploration.
The Mineral Resources were estimated in accordance with the Canadian Institute of Mining, Metallurgy and Petroleum (CIM), CIM Standards on Mineral Resources and Reserves, Definitions and Guidelines prepared by the CIM Standing Committee on Reserve Definitions and adopted by the CIM Council.
Historically mined areas were depleted from the Mineral Resource model.
Prices used are US$2,400/oz Au, US$28/oz Ag, US$4.25/lb Cu, US$0.97/lb Pb and US$1.30/lb Zn.
The pit-constrained respective oxide and sulphide AuEq cut-off grades of 0.08 and 0.12 g/t were derived from 45% Ag and 83% Au oxide process recovery, 40% Ag and 56% Au sulphide process recovery, US$5.25/t process and G&A cost. The constraining pit optimization parameters were $2.00/t mining cost and 45° pit slopes.
The out-of-pit AuEq cut-off grade of 1.28 g/t was derived with 93% Ag and 89% Au process recovery, US$28/t process and G&A cost, and a $60/t mining cost. The out-of-pit Mineral Resource grade blocks were quantified above the 1.28 g/t AuEq cut-off, below the constraining pit shell and within the constraining mineralized wireframes. Out-of-Pit Mineral Resources are restricted to the El Tigre Main Veins, which exhibit historical continuity and reasonable potential for extraction by cut and fill and long hole mining methods.
The Stockpile AuEq cut-off grade of 0.46 g/t was derived from 85% Ag and 85% Au process recovery, US$28/t process and G&A cost, and a $2/t mining cost.
The Tailings AuEq cut-off grade of 0.45 g/t was derived from 83% Ag and 82% Au process recovery, US$28.72/t process and G&A cost.
AgEq and AuEq were calculated at an Ag/Au ratio of 178:1 (oxide) and 120:1 (sulphide) for pit-constrained Mineral Resources.
AgEq and AuEq were calculated at an Ag/Au ratio of 82:1 for out-of-pit Mineral Resources.
AgEq and AuEq were calculated at an Ag/Au ratio of 86:1 for Low-Grade Stockpile Mineral Resources.
AgEq and AuEq were calculated at an Ag/Au ratio of 85:1 for Tailings Mineral Resources.
Totals may not sum due to rounding.
Exploration Potential
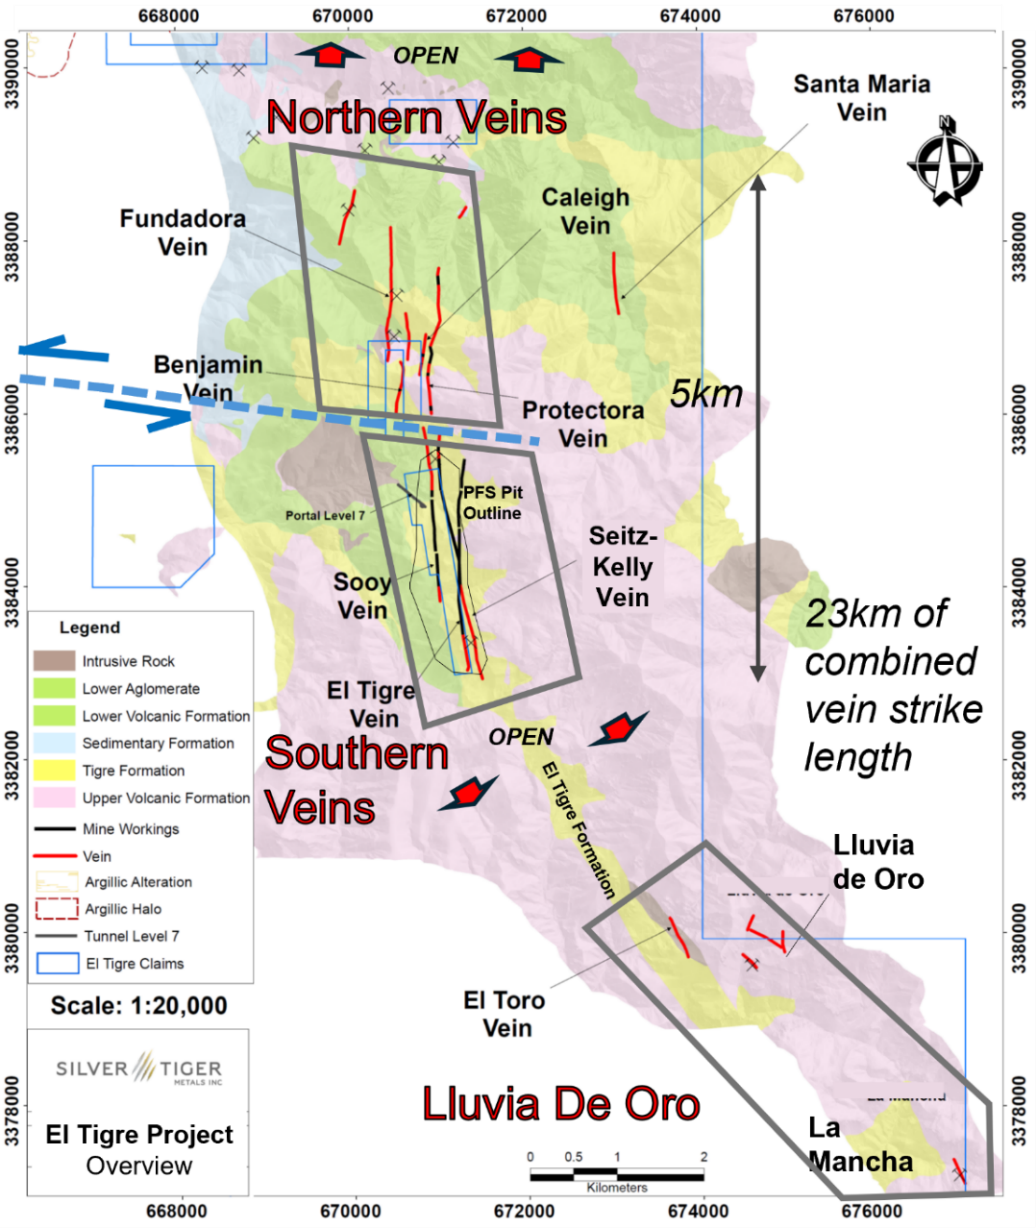
The El Tigre historical mine district is located in Sonora, Mexico and lies at the northern end of the Sierra Madre silver and gold belt which hosts many epithermal silver and gold deposits, including Dolores, Santa Elena and Las Chispas. The high-grade epithermal veins dip steeply to the west, and are typically 0.5 m wide, and locally can be up to 5 m in width. Over 25 km of these veins have been mapped along strike on surface at El Tigre. Based on the extensive historical workings, veins are inferred to extend to more than 450 m depth with many reaching strike length of 3 km or more. On the prospective El Tigre Property are both brownfields and greenfields targets defined by extensive Silver Tiger drilling (>120 km) and over 60 discovered small-scale workings in addition to the historic El Tigre Mine. The little drilled Northern Veins have the same geology and structure at the Southern Veins, for which the PEA is based on (Figure 4). Whereas Lluvia de Oro shows potential for Property pit expansion with the conjunction of high grade veins and the host to the Stockwork Zone: the El Tigre Formation.
Figure 4: Plan View Map Showing Northern, Southern and Lluvia de Oro Veins
Northern Veins - Historical North El Tigre Mine
The Northern Veins have over 10 km of combined strike length confirmed by surface mapping and sampling, drilling, and sampling of historical UG workings. The Northern Veins, a faulted offset of the Southern Veins, exhibit the same structure, mineralogy, grades, orientations, strike length (1-2 km) and width (1-2 m) as the well-defined Southern Veins, and have the potential to be equally endowed. With extensive shallow workings, and promising drill results this area makes a promising brownfields target to expand on. Reconnaissance drilling was conducted on the Northern veins by the Company in 2017 and 2020, before shifting focus to the development of the Vein Area around the historical El Tigre Mine. Significant veins were consistently intercepted in the North proving the continuity and grade seen in the underground historical workings. Anaconda (c. 1982-83) also drilled the Northern Area, as well as completed an exploration drift.
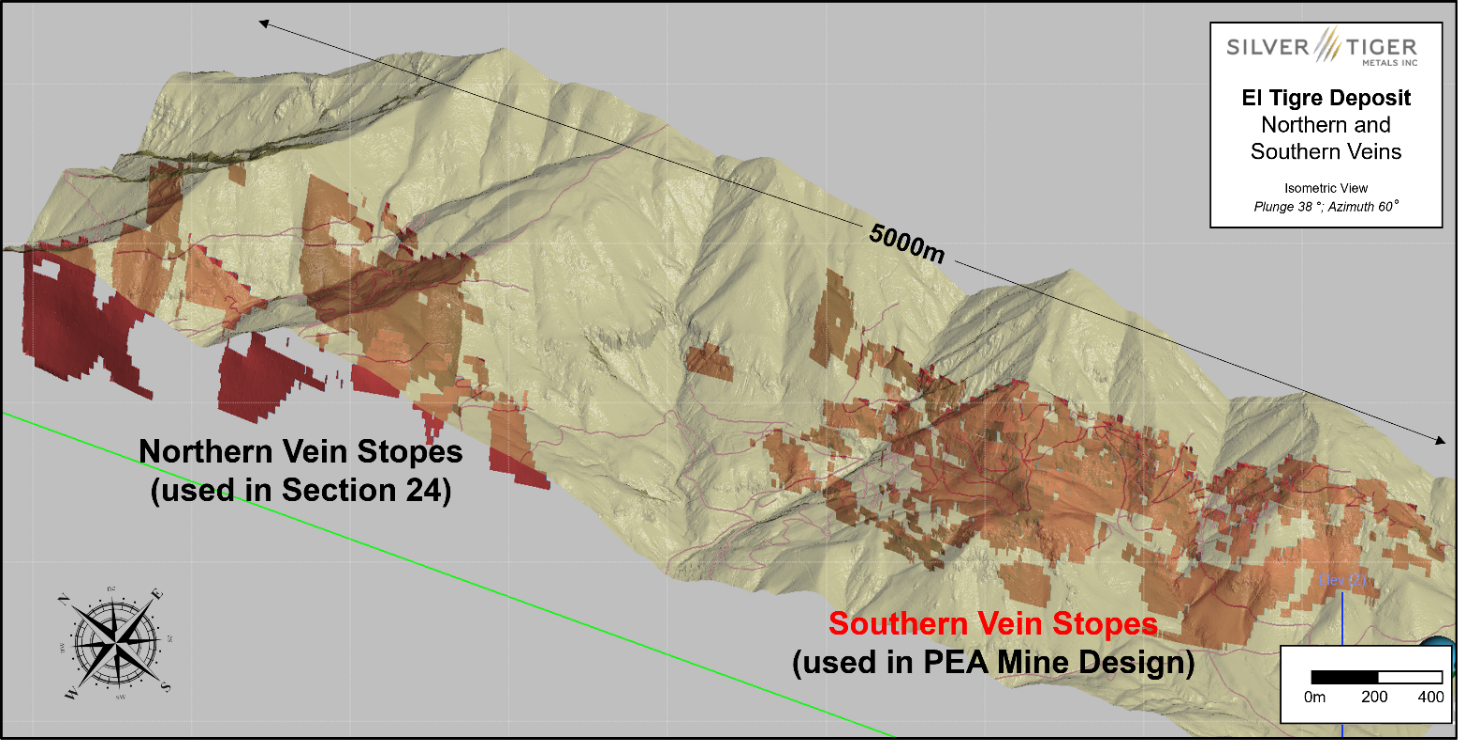
Separate to the UG PEA mine design (in Southern Veins), a stope-constrained Mineral Resource Estimate has been established in the Northern Veins located north of the PEA Mineral Resource and historically mined for high grade silver (Table 11). A preliminary mine plan outlined in the PEA indicates that a total of 2.95 Mt at an average grade of 343 g/t AgEq containing 31.5 Moz AgEq utilizing longitudinal retreat mining; however, specific costing and scheduling was not completed. A preliminary design shows the potential for a mine life of in excess of 10 years at 290 ktpa (nominally 800 tpd). Infill drilling is needed to prove-up this Mineral Resource, with a Phase1 Drilling 5,000 m drilling program starting Q1 2026 in this area (Figure 5).
Table 11: El Tigre North Mineral Resource
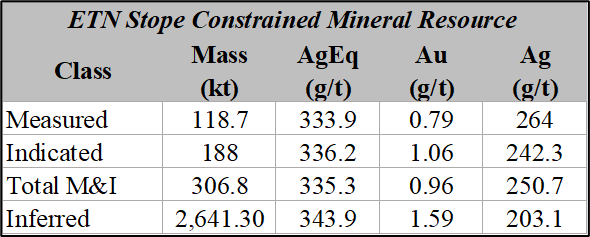
Figure 5: Isometric View of Northern and Southern (focus of PEA) Veins showing designed Stopes
Near-Mine Exploration
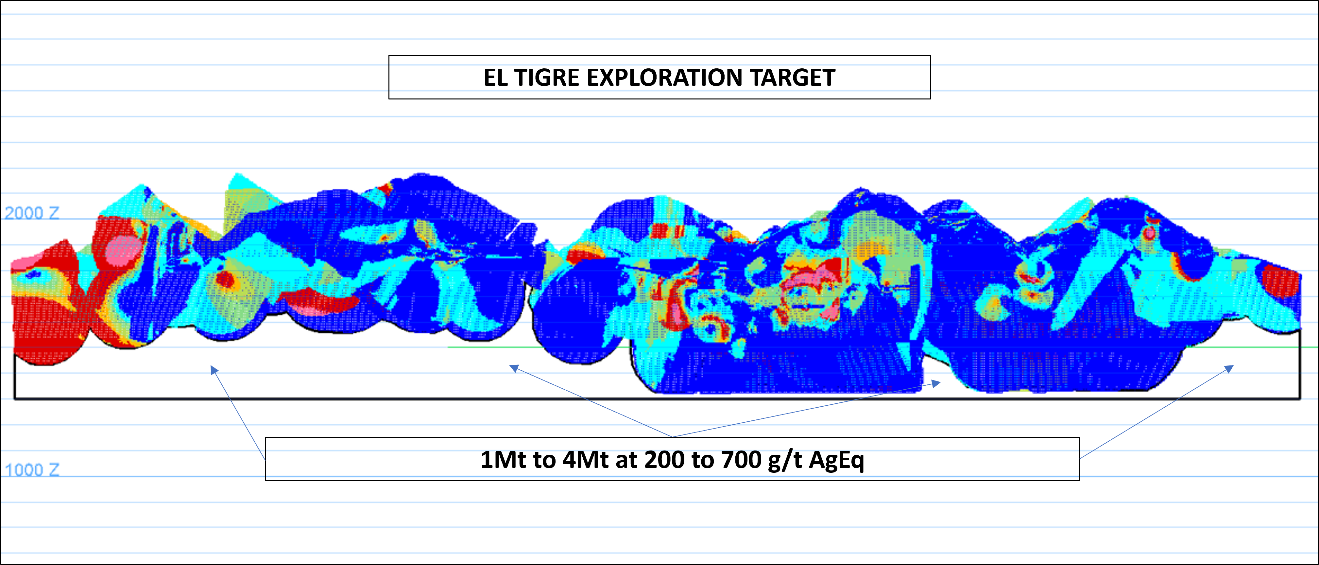
With prospective areas down dip of Northern Veins (El Tigre #2) and down dip of PEA focused Southern Veins with the disclosed Exploration Target establishing 1 to 4 million tonnes at 200 to 700 g/t AgEq (Figure 6). These areas are the along strike and dip of defined veins, are defined as "Exploration Potential" in the block model and would require infill drilling to reach Inferred classification. Underground drilling will target much of this Resource with infill and near-mine exploration. Due to higher grade, reduced tonnage UG in 2026 MRE, the exploration target has consequently increased in grade, however, lowered in tonnage.
Figure 6: Longitudinal Projection of Northern and Southern Veins showing exploration potential down dip
Historical Lluvia de Oro Mine
Reconnaissance mapping and sampling was conducted in the Lluvia de Oro Mine Area by the Company in 2016 and 2020, on the Lluvia de Oro prospect. The El Toro and La Mancha Veins while mapped remain unsampled.
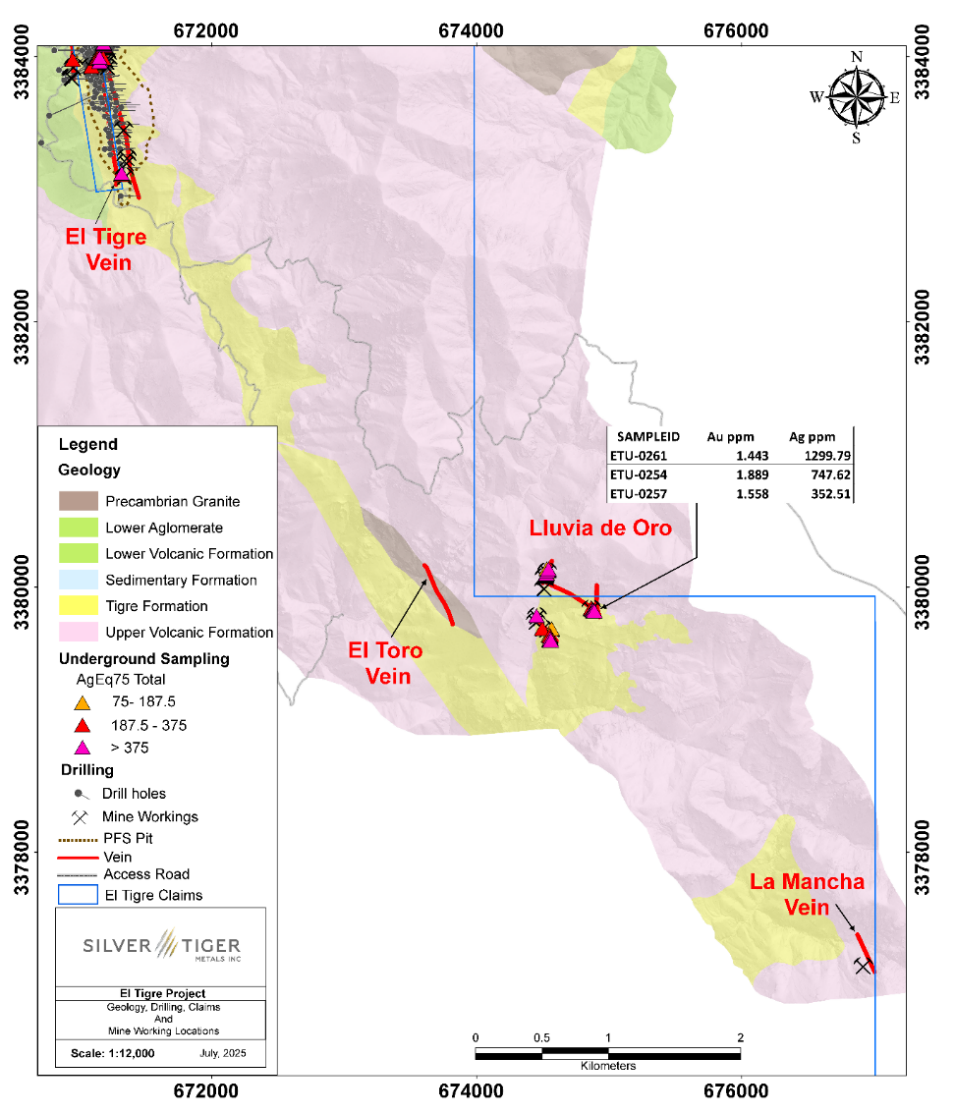
Significant historic UG workings (>500 m in length) were found in Lluvia de Oro with grab sampling completed in a 2020 program returning assays up to 1.90 g/t gold and 1,300 g/t silver (Figure 7). Importantly, the Lluvia de Oro vein system is contained within the El Tigre formation, the host to the Stockwork Zone of which the 2024 PFS is centered. There is significant potential to extent Stockwork Zone mineralization from the far south of the proprosed pit 5 km to south to Lluvia de Oro.
Exploration work here has the potential to expand the Stockwork Zone pit to the South substantially. Preliminary mapping and sampling have begun in this area with plans to drill in 2027.
Figure 7: Plan View El Tigre Project- Lluvia de Oro - Southern Veins
Surface Rights Agreement
The Company owns royalty-free, 100% of the 6,238 hectares land-package encompassing the footprint of proposed mining operation with no Ejido presence. In addition, the company controls 28,414 hectares of Concessions to conduct exploration along a 25 km strike length of the Sierra Madres.
Mineral Resource Estimate Methodology - El Tigre Project
The databases used for this Mineral Resource update contain a total of 20,149 drill hole collar records that contribute directly to the Mineral Resource Estimate and includes collar coordinates, down-hole survey, assay, lithology and bulk density data. Assay data includes Au g/t, Ag g/t, Cu %, Pb % and Zn % grades. The drilling extends approximately five km along strike. The average length of the diamond drill holes for all veins is 242.9 m, and the average nearest neighbour drill hole collar distance is 14.8 m.
P&E Mining Consultants Inc. ("P&E") collaborated with Silver Tiger geological personnel to develop the mineralization models, grade estimates, and reporting criteria for the Mineral Resources at El Tigre.
Mineralized domains were initially developed by Silver Tiger and were reviewed and modified by P&E. A total of twenty-three individual mineralized vein domains have been identified through drilling and surface sampling. Interpreted mineralization wireframes were developed by Silver Tiger geologists for the El Tigre Veins based on logged drill hole lithology, assay grades and historical records. Silver Tiger identified continuous zones of mineralization from assay grades equal to or greater than 0.30 g/t AuEq and 1.0 gpt AuEq for respective near surface and UG, with observed continuity along strike and down-dip, using a calculated Ag:Au equivalent factor of 75:1. The selected intervals include lower grade material where necessary to maintain wireframe continuity between drill holes. A minimum sample selection of two was used to ensure proper continuity.
A total of 5,542 bulk density values were determined by Silver Tiger from drill hole core. Mineralized bulk density values were assigned for each of the El Tigre Main Veins based on the median vein measurement. For the El Tigre North Veins, a bulk density of 2.65 t/m 3 was assigned.
Vein block grades for gold and silver were estimated by Inverse Distance Cubed ("ID3") interpolation of capped composites using a minimum of four and a maximum of twelve composites. Vein block grades for copper, lead and zinc were estimated by Inverse Distance Squared ("ID2") interpolation of capped composites using a minimum of four and a maximum of twelve composites.
For the El Tigre Veins, blocks within 30 m of three or more drill holes/channels were classified as Measured Mineral Resources, and blocks within 60 m of three or more drill holes/channels were classified as Indicated Mineral Resources. All additional estimated blocks within 180 m of a drill hole were classified as Inferred Mineral Resources.
The sensitivity of the Mineral Resource Estimate to changes in cut-off grade was examined by summarizing tonnes and grade at varying cut-off grades for the Out-Of-Pit Mineral Resources. The results suggest that the Mineral Resource models are relatively insensitive to small changes in cut-off grade.
P&E QPs consider that the block model Mineral Resource Estimates and Mineral Resource classification represent a reasonable estimation of the global Mineral Resources for the El Tigre Project with regard to compliance with generally accepted industry standards and guidelines, the methodology used for estimation, the classification criteria used and the actual implementation of the methodology in terms of Mineral Resource estimation and reporting. The Mineral Resources have been estimated in conformity with the requirements of the CIM "Estimation of Mineral Resource and Mineral Reserves Best Practices" guidelines (2019) as required by the Canadian Securities Administrators' National Instrument 43-101. Mineral Resources are not Mineral Reserves and do not have demonstrated economic viability.
Qualified Persons
Mineral Resource Estimate: Dave Duncan P. Geo. VP Exploration of Silver Tiger and Charles Spath P.Geo., VP of Technical Services of Silver Tiger, and Fred Brown, P.Geo., RM-SME Senior Associate Geologist of P&E Mining Consultants and Eugene Puritch, P.Eng., FEC, CET, President of P&E Mining Consultants have reviewed and approved the technical aspects of the press release and are the Qualified Persons as defined under National Instrument 43-101.
PEA and PFS: Andrew Bradfield, P. Eng., COO of P&E Mining Consultants, Eugene Puritch, P.Eng., FEC, CET, President of P&E Mining Consultants, David J. Salari, P. Eng. President of D.E.N.M. Engineering Ltd, and James Smith, P. Eng., Senior Geotechnical Engineer at WSP have reviewed and approved the technical aspects of the press release and are the Qualified Persons as defined under National Instrument 43-101.
About Silver Tiger
Silver Tiger is constructing the El Tigre Stockwork Zone Project, a silver and gold project located in Sonora, Mexico. The project is 100% owned by Silver Tiger and covers over 28,000 hectares. The previous Technical Report titled Pre-Feasibility Study of the El Tigre Silver-Gold Project, Sonora, Mexico dated October 22, 2024 is available on SEDAR+ and under the Corporation's profile as well as on the Silver Tiger website at www.silvertigermetals.com
VRIFY Slide Deck and 3D Presentation - Silver Tiger's El Tigre Project
VRIFY is a platform being used by companies to communicate with investors using 360° virtual tours of remote mining assets, 3D models and interactive presentations. VRIFY can be accessed by website and with the VRIFY iOS and Android apps.
Access the Silver Tiger Metals Inc. Company Profile on VRIFY at: https://vrify.com
The VRIFY Slide Deck and 3D Presentation for Silver Tiger Metals Inc. can be viewed at: https://vrify.com/explore/decks/492 and on the Corporation's website at: www.silvertigermetals.com .
Procedure, Quality Assurance / Quality Control and Data Verification
The diamond drill core (HQ size) is geologically logged, photographed and marked for sampling. When the sample lengths are determined, the full drill core is sawn with a diamond blade drill core saw with one half of the drill core being bagged and tagged for assay. The remaining half portion is returned to the drill core trays for storage and/or for metallurgical test work.
The sealed and tagged sample bags are transported to the Bureau Veritas facility in Hermosillo, Mexico. Bureau Veritas crushes the samples (Code PRP70-250) and prepares 200-300 gram pulp samples with ninety percent passing Tyler 200 mesh (Code PUL85). The pulps are assayed for gold using a 30-gram charge by fire assay (Code FA430) and over limits greater than 10 grams per tonne are re-assayed using a gravimetric finish (Code FA530). Silver and multi-element analysis is completed using total digestion (Code MA200 Total Digestion ICP). Over limits greater than 100 grams per tonne silver are re-assayed using a gravimetric finish (Code FA530).
Quality assurance and quality control ("QA/QC") procedures monitor the chain-of-custody of the samples and includes the systematic insertion and monitoring of appropriate control materials (certified reference materials, blanks and duplicates) into the sample strings. The results of the assaying of the QA/QC material included in each batch are tracked to ensure the integrity of the assay data. All results stated in this announcement have passed Silver Tiger's QA/QC protocols.
For further information, please contact:
Devin Devarennes
VP Business Development & Investor Relations
902 233 3656
devin@silvertigermetals.com
CAUTIONARY STATEMENT:
Neither TSX Venture Exchange nor its Regulation Services Provider (as that term is defined in the policies of the TSX Venture Exchange) accepts responsibility for the adequacy or accuracy of this release.
This News Release includes certain "forward-looking statements". All statements other than statements of historical fact included in this release, including, without limitation, statements regarding potential mineralization, resources and reserves, the ability to convert Inferred Mineral Resources to Indicated Mineral Resources, the ability to complete future drilling programs and infill sampling, the ability to extend Mineral Resource blocks, the similarity of mineralization at El Tigre to Delores, Santa Elena and Chispas, exploration results, and future plans and objectives of Silver Tiger, are forward-looking statements that involve various risks and uncertainties. Forward-looking statements are frequently characterized by words such as "may", "is expected to", "anticipates", "estimates", "intends", "plans", "projection", "could", "vision", "goals", "objective" and "outlook" and other similar words. Although Silver Tiger believes the expectations expressed in such forward-looking statements are based on reasonable assumptions, there can be no assurance that such statements will prove to be accurate and actual results and future events could differ materially from those anticipated in such statements. Important factors that could cause actual results to differ materially from Silver Tiger's expectations include risks and uncertainties related to exploration, development, operations, commodity prices and global financial volatility, risk and uncertainties of operating in a foreign jurisdiction as well as additional risks described from time to time in the filings made by Silver Tiger with securities regulators.
SOURCE: Silver Tiger Metals Inc.
View the original press release on ACCESS Newswire
