


Written by Peter Bell on September 5, 2025 for the Munich Personal RePEc Archive:
https://docs.google.com/document/d/1BgN5AQSI8YGKlyq_1Ds_Y8UrKYcSVfFTohiIcGwdyIk/edit?tab=t.0
Abstract
This paper presents an example of simulating financial economics for a mining exploration project based on stylized assumptions and real global data. The data comprise all the volcanogenic massive sulphide deposits of the world, according to a 2009 public report from the United States Geological Survey, which contains a database of grade and tonnage models for such deposits. The grade and tonnage parameters help estimate the gross metal value of the deposits, according to some simplifying assumptions. The paper further makes assumptions about the costs and benefits of finding each deposit in the global database. Then it calculates the distributions of economic returns for different approaches to the mining exploration business.
Keywords: Engineering Economics, Mining, Royalties, Finance
JEL Codes: C00 General; G00 General; L72 Mining, Extraction, and Refining
Mining Exploration Business Valuation Simulations with Global VMS Deposits Database
My article (Bell, 2015) describes the mineral exploration business as a game of chance, using a toy model, and shows how to simulate economic returns under stylized assumptions. The key aspect of mining exploration is that it’s a costly business, where companies identify projects that may contain mineral deposits and then pay for information to determine whether they should proceed with or abandon the project.
I only consider exploration companies that do not have any source of revenue because these particular companies have unusual features. For example, the way mining exploration companies use high-risk equity finance to fund exploration means that the shares can function like options, where the entire valuation of the company can be based solely on the speculative value of the potential payoff from finding a mineral deposit with large grade and tonnage. Although other parameters, such as social license, are essential to the option valuation of mining projects, this paper shows how to use a basic public database to estimate the distribution of economic returns to speculation on mineral deposits and identify stylized features such as fat tails.
The database is sourced from the United States Geological Survey (Mosier, Berger, and Singer, 2009) to represent all the world's volcanogenic massive sulphide deposits. These are one of several types of deposits that deserve consideration. I have started with only one type of deposit to simplify the exercise. In addition, I clean the data in the following ways. I drop all deposits that have missing grade and tonnage numbers, which is 233 data points. Additionally, 14 deposits are missing grade numbers.
The total number of data points that I use is 819 deposits, and I use only the copper grade and tonnage in all calculations. There are additional data fields in the database that are useful, such as other metals like zinc. There are different types of important information, like metallurgical recovery, that are not included in the database. I use a scatterplot of copper grade and tonnage to characterize the data universe for all projects.
The descriptive statistics for the grade and tonnage data both show fat tails, with kurtosis values of 6 and huge ranges.
Tonnage (Mt); Copper Grade (%)
Average: 6.5; 1.8
Range: 62.4; 10.2
Std. Dev.: 10.9; 1.5
Kurtosis: 6.8; 6.7
I calculate the Gross Metal Value as follows: tonnage times copper grade times copper price. I assume copper prices are $10,000 per tonne. The average gross metal value for all deposits in my calculations is $1,054,975,845, over one billion dollars.
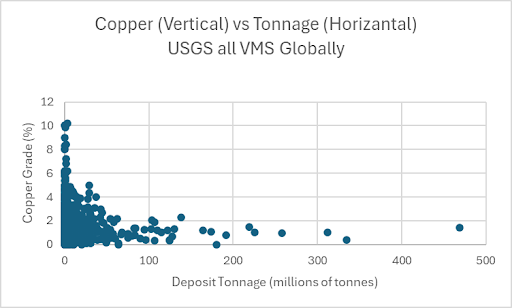
The scatterplot of grade-tonnage shows essential features of the distribution for all VMS deposits around the world. The fat tails are clearly demonstrated in terms of tonnage and grade, but they generally appear along one dimension or the other. There are no projects with record high levels of both grade and tonnage for the same deposit. Any deposit with an unusually high grade typically has low tonnage. And any deposit that has a huge tonnage typically has a lower grade. By calculating the gross metal value based on the product of the grade and tonnage, this simulation exercise is driven by the extreme statistical nature in both dimensions. For example, the kurtosis of the gross metal value itself is over 14!
The fat tails in grade, tonnage, and gross metal value drive the potential for large economic gains for mining exploration companies that can be involved in finding unusually valuable deposits. Can a company find a deposit for less than the valuation Mister Market gives to it? Another aspect of the fat tails is the fact that most deposits are small tonnage, low grade, and have gross metal value below one billion dollars. This concentration near zero reflects the fact that most deposits do not become mines.
Exploration Business Simulation
For this toy model, mineral deposits are characterized by a grade-tonnage data pair. The grade-tonnage is combined to calculate gross metal value, which puts a dollar value on the size of the prize. Mister Market assigns a valuation to each project based on the gross metal value, and the exploration companies attempt to find projects that are worth more than they cost to find.
This is a highly simplified approach to the mining exploration business that utilizes data after mineral deposits are identified and defined, incurring significant costs, but does not account for the substantial uncertainty that exists before a deposit is discovered. In fact, the model also does not consider uncertainty in the grade or tonnage for the deposits that have already been defined in the database, which can change significantly as more exploration work is completed or even how existing deposit scale information is remodelled over time by different exploration companies. There is potential to further expand the present analysis in several ways, such as considering all exploration projects that never became deposits in the USGS database.
I assume that the finding costs for all deposits are calculated as follows. First, I calculate the average gross metal value for all projects and then set the finding costs equal to 1% of the average gross metal value. This assumption makes the calculations tractable and is intended to reflect the idea that all deposits require a similar amount of exploration spending to define them. This assumption fails to reflect how larger deposits generally require more spending.
In this case, I calculate the finding costs to be $10,549,758 for all deposits in the database.
I assume the project market value for each project is calculated separately as follows. First, I calculate the gross metal value for one project and then set the value of the deposit equal to 5% of the gross metal value.
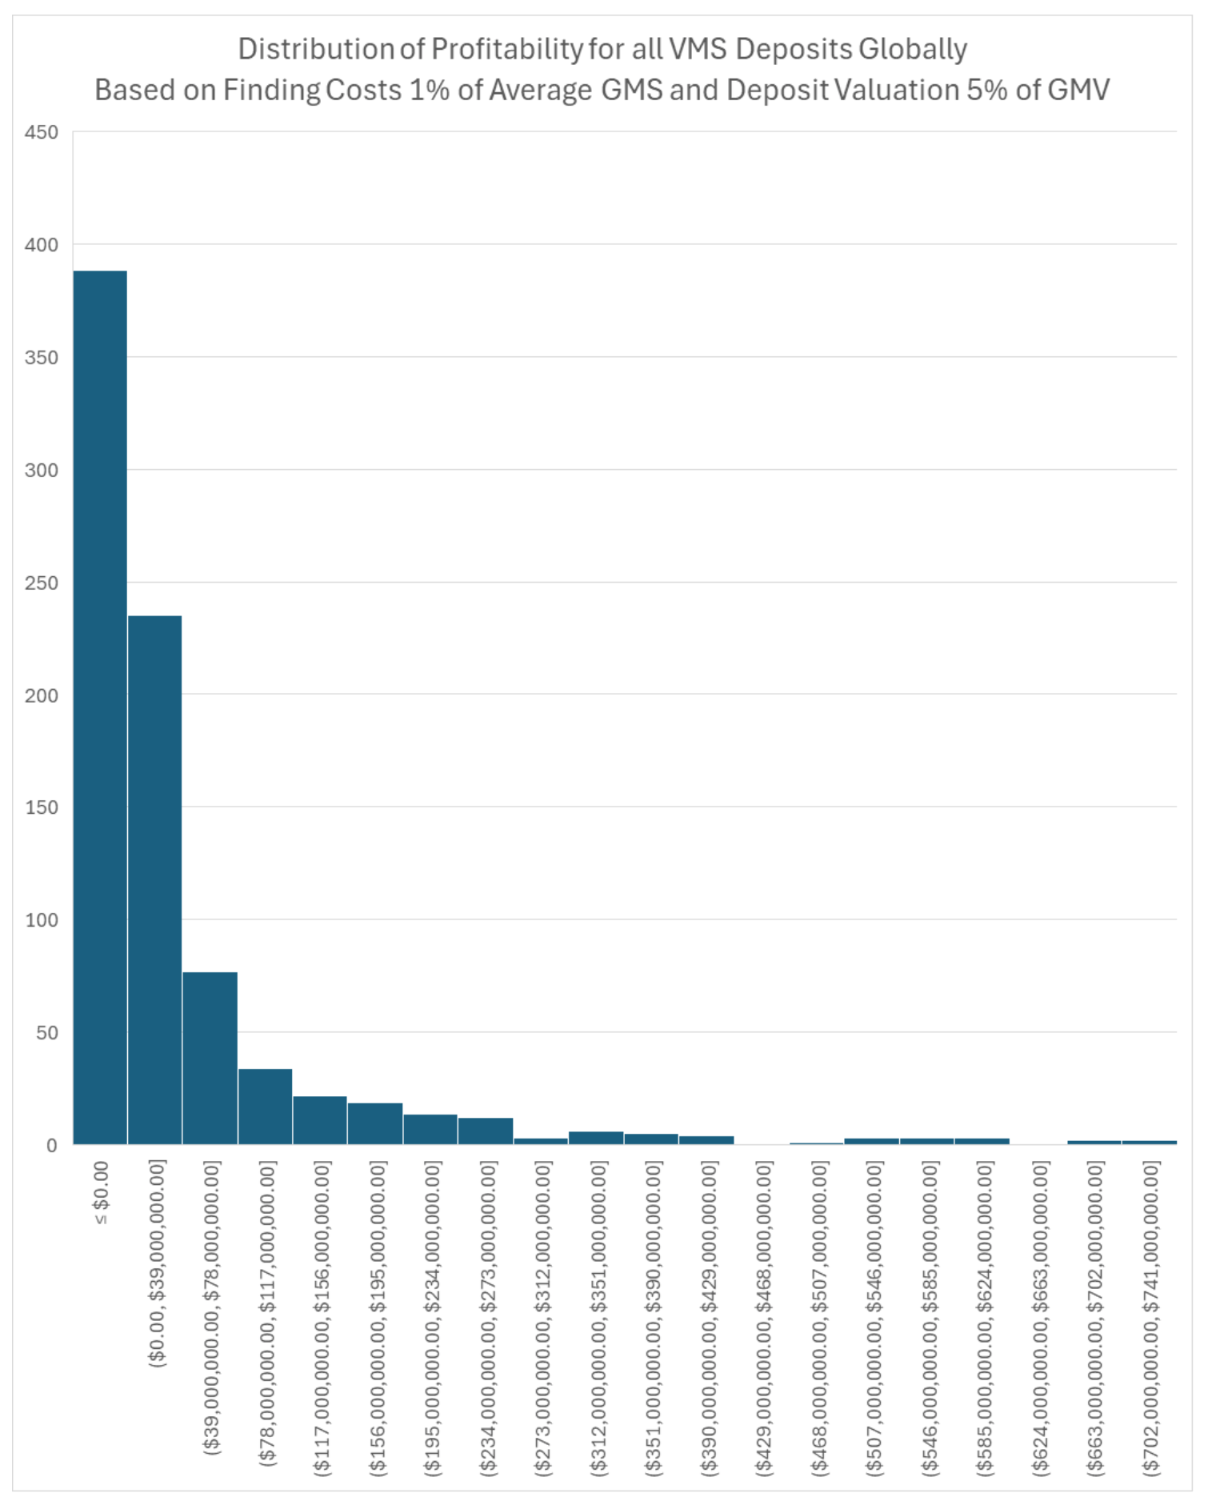
I calculate the “Profitability” for each project based on the project value minus the finding costs. Three hundred eighty-eight mineral deposits have a negative profitability. The average profit is around forty-two million dollars, and the maximum is over seven hundred million dollars.
Profitability (All Projects)
Average: $42,199,033.81
Minimum: -$10,538,258.45
Maximum: $729,450,241.55
Std. Dev.: $104,273,200
Kurtosis: 15
The distribution of the profitability for all deposits shows several important features. For one, many deposits have a negative economic return. Additionally, a few deposits have extremely high returns. These two features echo how the mining exploration business is characterized by losers, except for the few large winners who provide enough appeal to draw speculators into the entire business endeavour.
Comparing Exploration Strategies
I propose two different exploration strategies to represent how exploration companies search for deposits: minimum tonnage and minimum grade. Rather than looking for an average deposit, these strategies reflect different priorities based on geology; better project selection means the exploration company doesn’t spend on weaker projects, avoids wasting time and focuses on bigger and better prizes. On an a priori basis, it is possible to screen potential deposits based on their ability to hold a minimum amount of tonnage or a minimum grade. In reality, this screening effort is subject to significant uncertainty. I assume the strategies are 100% effective at discriminating project selection and compare the returns using each strategy.
The large tonnage search strategy has a tighter distribution with lower kurtosis, a larger average, and a larger minimum value. Hunting for larger projects is a better business strategy. Large projects have all the same problems as smaller ones, so it’s better to go big. Additionally, focusing on larger projects enables the exploration company to define fewer projects and achieve fewer losing outcomes.
Profit (+1.5Mt Projects)
Average: $80,588,682.30
Minimum: -$9,794,758.45
Maximum: $729,450,241.55
Std. Dev.: $126,969,593
Kurtosis: 8
Total Number of Projects: 465
Number Less than zero: 57
The histograms further demonstrate that the strategy focusing on larger deposits yields better returns.
The strategy focused on larger projects has fewer losing projects overall and more frequent, larger winners. Further descriptive statistics show how project selection criteria improve the economic returns of exploration.
All Projects
Total: 833
"Swing Rate": 100%
Number of Profitable Deposits: 445
"Hit Rate": 53%
Average Return: $42,199,034
Finding Costs: $10,549,758.5
Ratio Average Return / Finding Costs: 4.0
Minimum Tonnage (+1.5Mt)
Minimum Tonnage (+1.5Mt)
Total: 833
"Swing Rate": 56%
Number of Profitable Deposits: 408
"Hit Rate": 88%
Average Return: $80,588,682
Finding Costs: $10,549,758.5
Ratio Average Return / Finding Costs: 7.6
Focusing on larger projects has a significant impact on returns by causing fewer losing projects overall and more frequent, larger winners. Further descriptive statistics show how project selection criteria improve the economic returns of exploration.
Discussion
There are several substantial limitations to this modelling exercise. For example, other metals like zinc are missing from the calculations. For another, there is no consideration of metallurgy or capital costs for the valuation of any deposits.
The toy model assumes that total finding costs are equal for all projects, which is debatable because larger projects require more exploration work and larger total finding costs. An industry standard statistic is to estimate finding costs in terms of units of metal endowment, like a tonne of copper, rather than total value. It is possible to use these unit-based finding costs to provide a more refined estimate of the finding costs for each deposit. Furthermore, the market multiple of 5% of gross metal value is another industry standard statistic that can be estimated from real data, where different projects have different market multiples to reflect factors such as metallurgy or capital costs beyond the basic grade-tonnage data.
References
Bell, Peter N, 2015. "Mineral exploration as a game of chance," MPRA Paper 62159, University Library of Munich, Germany.
Mosier, D.L., Berger, V.I., and Singer, D.A., 2009, Volcanogenic massive sulfide deposits of the world; database and grade and tonnage models: U.S. Geological Survey Open-File Report 2009-1034 [https://pubs.usgs.gov/of/2009/1034/].
