$TSLA $TSLA.US is coiling. Stick with me, there are a few charts here....
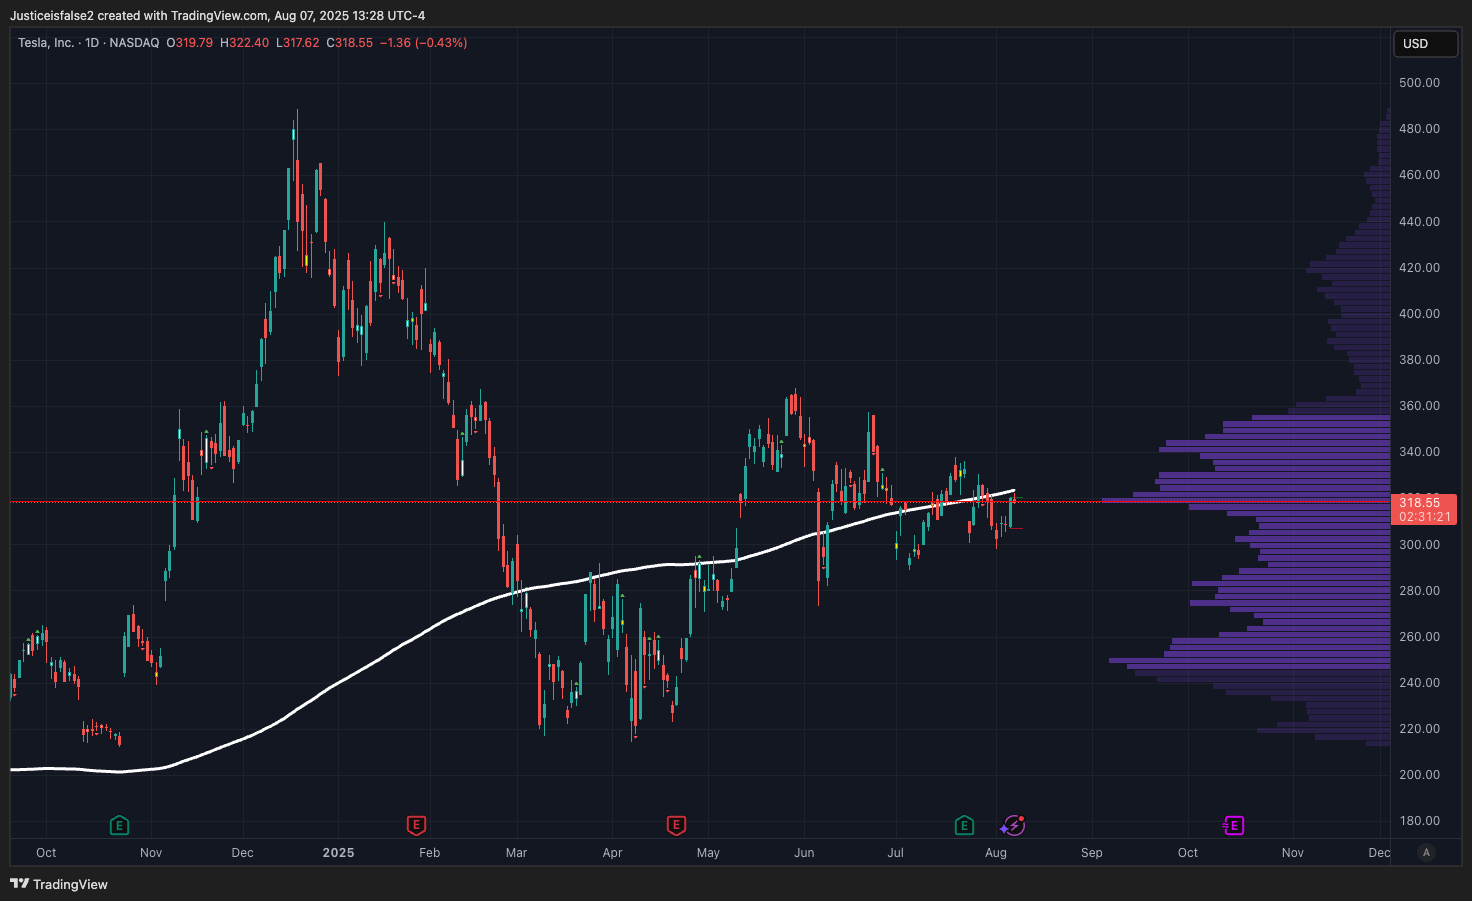
On a daily timeframe the price is compressing a the 2025 Point Of Control POC (red line) where the bulk of the volume has occurred in 2025. This $320ish level is right below the 200sma (white). For a highly volatile stock, it is somewhat unusual for it to just hang out for took long, so something is gonna give.
If we zoom out to a weekly timeframe, we may get some more indication of where things may go. As we can see in the first chart below, during the Spring 2025 tarrif selloff, $TSLA.US eventually found support around the weekly 200sma. Once there was a weekly close above 280 it quickly found buyers and it retraced 50% of the down move.
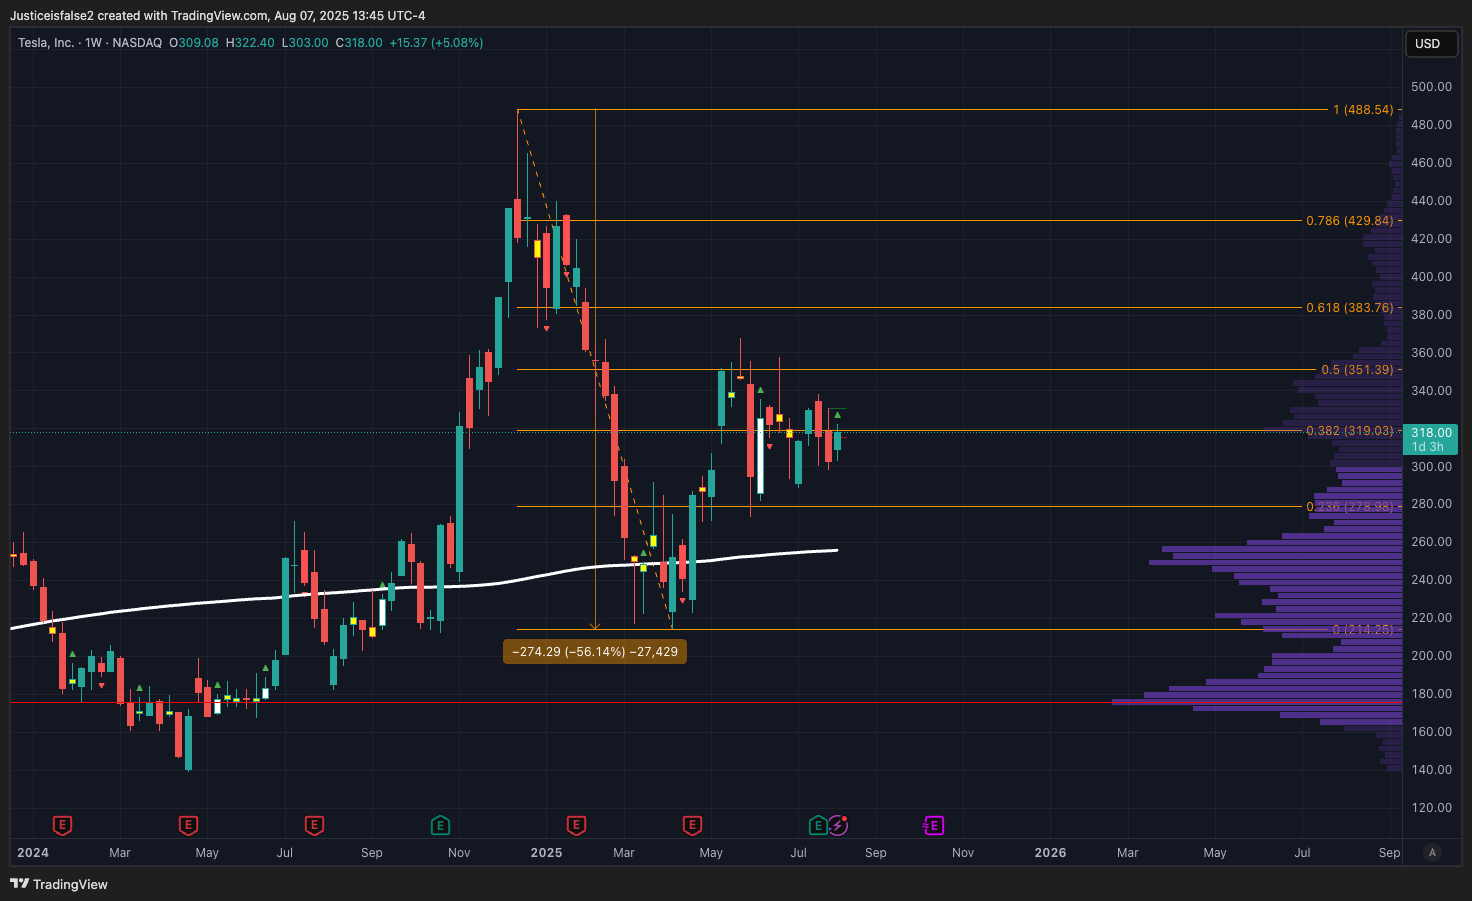
Then in the first week of june there was a correction to .618 of the Apr-May move. A standard affair and a great entry on the weekly.
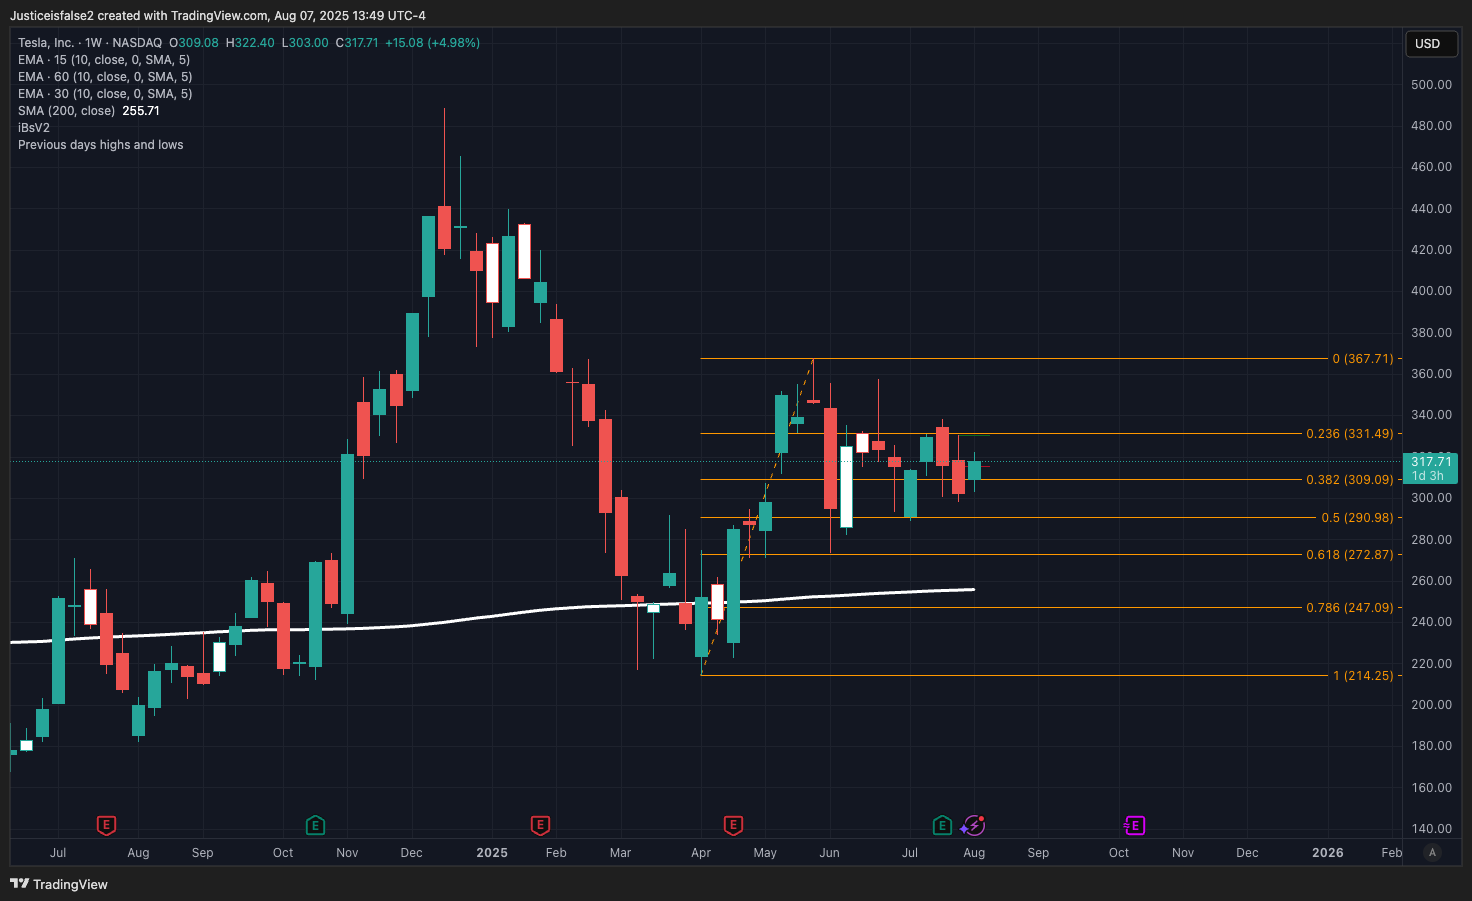
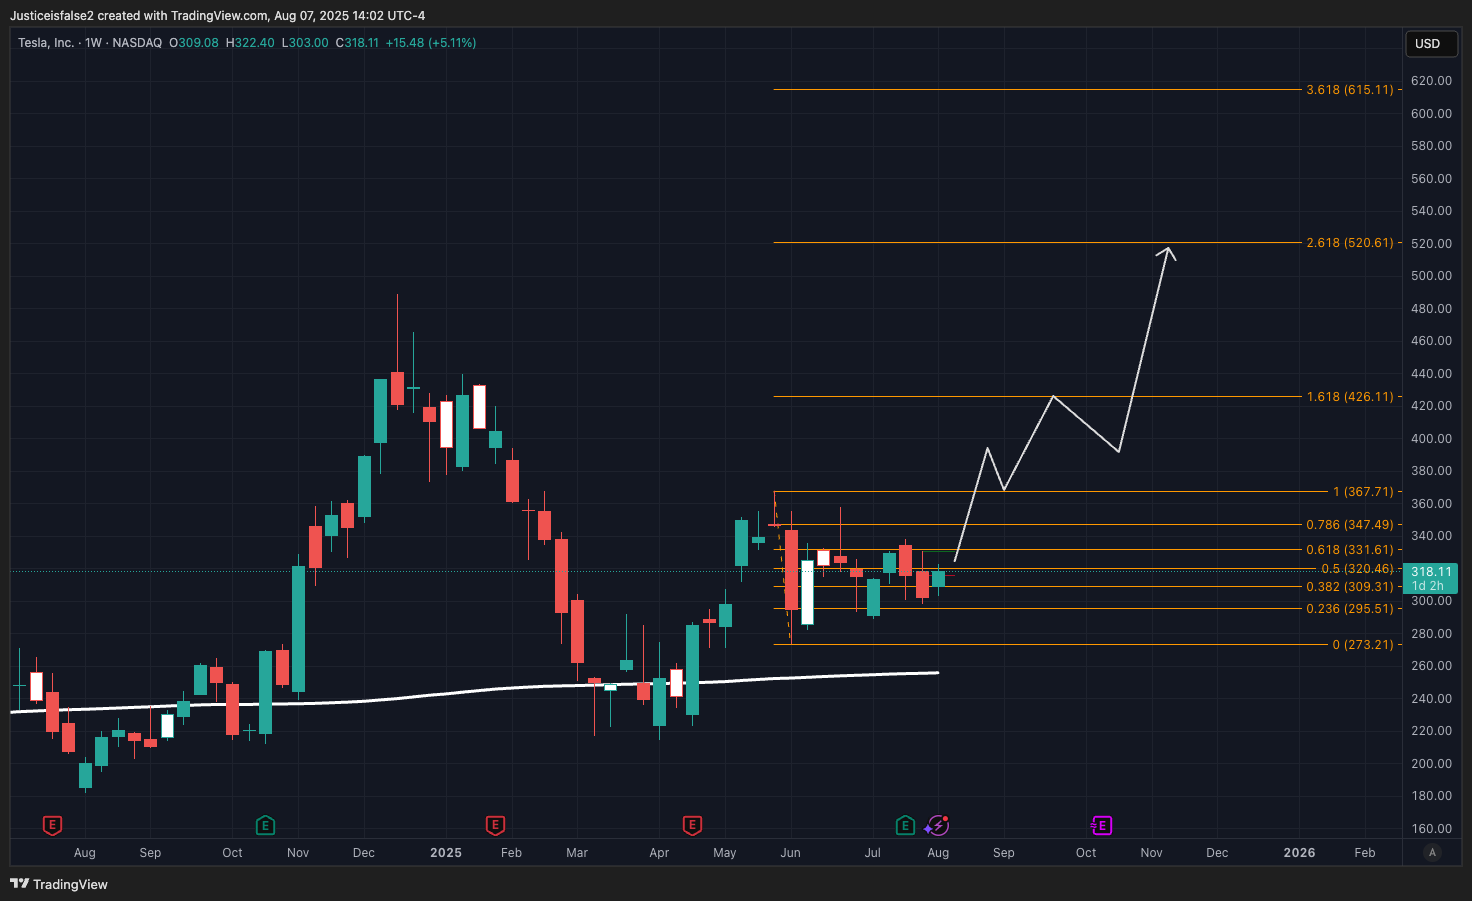
That's all nice, but what next? Best way to infer on that is to look at the past - where did we come from? To my eye, I see a rally off a firm base followed by a lot of consolidation. Continuation patterns tend to resolve in direction from which they come - my opinon is that this resolves up but there needs to be confirmation. By confirmation, I would want to see a weekly close above 330.
If $TSLA is gonna keep moving, some of the targets are pretty big at $420-430 then 500-520 and then 615(!). Nothing happens in a straight line but some of the moves can be explosive/violent.