VANCOUVER, British Columbia, July 08, 2025 (GLOBE NEWSWIRE) -- West Red Lake Gold Mines Ltd. (“West Red Lake Gold” or the “Company”) (TSXV: WRLG) (OTCQB: WRLGF) is pleased to announce the positive results of a Preliminary Economic Assessment (“PEA”) prepared in accordance with National Instrument 43-101 – Standards of Disclosure for Mineral Projects (“NI 43-101”) for a toll milling mine operation at its 100%-owned Rowan project in the Red Lake Gold District of northwestern Ontario, Canada (“the Rowan Project”).
All dollar amounts in this news release are in Canadian dollars unless otherwise indicated.
The effective date of the PEA is June 30th, 2025, and a technical report relating to the PEA (the “Technical Report”) will be filed on SEDAR+ within 45 days of this news release.
Rowan PEA Highlights:
- High-Grade Efficient Mine: Underground mine via long hole retreat method, delivering an average diluted head grade of 8.0 grams per tonne (“g/t”) gold (“Au”), accentuated by 10.4 g/t Au average grade in Year 1.
- Notable Production: 35,230 oz. average annual Au production over the 5-year mine life from an average mining rate of 385 tonnes per day (“tpd”).
- Strong Value: $125.3M post-tax Net Present Value (“NPV”) at US$2,500 per oz Au. Post-tax NPV rises to $239M at US$3,250 per oz Au.
- Low Costs and Strong Returns: US$1,408/oz all-in sustaining cost (“AISC”) and 41.9% post-tax internal rate of return (“IRR”), underscoring the viability of the Company’s second potential mine in the region. IRR increases to 81.7% at a US$3,250/oz gold price.
- Modest Initial Capital: Multiple mills in the area with excess capacity create the opportunity to develop Rowan as a toll milling operation with initial capital of just over $70 million.
- High Confidence Inventory: PEA mine design includes 63% of mined tonnes and 72% of mined ounces from the Indicated category – provides solid base for transition into prefeasibility study (“PFS”) level assessment.
- Simple Metallurgy: Free gold-dominant mineralization resulting in 75.8% to 94.9% gold recovery through gravity processing during metallurgical test work, which also supports toll milling potential.
- Development and Permitting Timeline: The Company plans to complete a Pre Feasibility Study (“PFS”) on the Rowan Project by Q3 2026, to continue advancing this valuable opportunity. The final year of 3-year baseline environmental data collection period is underway and the Company has been engaging with the regulators to support an expedited permitting process. New Bill 5 legislation in Ontario is intended to speed up the mine approval process. The WRLG team will work with the regulators and its Indigenous partners to permit and construct the Rowan Mine.
- Significant Exploration and Growth Potential: There are multiple opportunities to define additional mineralization at Rowan by (1) expansion drilling on the two main veins of the deposit included in this PEA mine plan (v001 and v004) especially at depth, (2) infill and expansion drilling on parallel veins adjacent to the PEA mine plan with data gaps stemming from selective historic drill sampling, (3) drill testing expansion targets along strike from the Rowan vein system, and (4) testing high potential new targets at the property including Apex and Big Bend.
“Rowan is a high grade, relatively wide, nearly vertical deposit that starts at surface and this PEA captures how such designed-for-mining characteristics lead to strong economics,” said Shane Williams, President and CEO. “There is ample opportunity to grow the resource further at Rowan along strike, at depth, and via discovery at new nearby targets, but we ideally want to do that work while turning this asset into a mine sending high-grade mineralization to an operating mill in the area and potentially generating significant revenue for the Company.
“A NPV of $239 million at close-to-spot gold pricing provides a compelling case to advance Rowan swiftly from here. We plan to advance engineering work while completing a drill program to infill gaps that prevented parts of the resource from being considered in the mine plan and upgrade roughly 37% of the mine plan tonnes that currently sits within the inferred resource category. That work will inform and maximize the value outlined in a PFS that we target issuing within 12 months that would be completed in tandem with permitting efforts at Rowan. It is also positive that the recent enactment of Bill 5 in Ontario creates potential for a simplified, collaborative, and expedited permitting process.”
The PEA was prepared by independent consultants Fuse Advisors, with input from Sims Resource LLC (resource estimate and modeling), Knight Piesold (tailings and waste rock), Integrated Sustainability Inc (water treatment), and PHC Inc (underground geotechnical).
Economic Results and Sensitivities
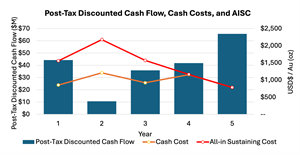
Table 1 summarizes the projected production and economic results of the PEA. Figure 1 shows post-tax discounted cash flows, cash costs, and AISC by year.
Table 1: Rowan Mine PEA – Key Economic Assumptions and Results
| Mine Life | yrs | 5 | ||
| Total Ore Mined | kilotonnes | 705 | ||
| Steady State Mining Rate | tpd | 385 | ||
| Average Head Grade | Au g/t | 8.0 | ||
| Gold Recovery | % | 97% | ||
| Average Annual Gold | oz / year | 35,230 | ||
| Total Payable Gold | oz. | 176,155 | ||
| Life of Mine Cash Cost | US$/oz | US$963 | ||
| Long Term Gold Price | US$/oz | $2,500 | ||
| Exchange Rate | CDN$ : US$ | 1.35 | ||
| Total Revenue | C$M | $593.9 | ||
| Initial Capital | C$M | $70.4 | ||
| Sustaining Capital | C$M | $102.6 | ||
| Average AISC | US$/oz | US$1,408 | ||
| Cumulative Net Cash Flow (pre-tax) | C$M | $189.1 | ||
| Cumulative Net Cash Flow (post-tax) | C$M | $155.1 | ||
| NPV (post-tax) | C$M | $125.3 | ||
| IRR (post-tax) | % | 41.9% | ||
| Discounted Payback Period | yrs | 2.4 |

Figure 1: Rowan Mine Post-Tax Discounted Cash Flows, Cash Costs, and All-In Sustaining Costs by Year
Upside Potential
There are multiple opportunities to potentially expand and upgrade the resource and mine plan at Rowan.
The Rowan resource comprises 26 domains that capture multiple parallel veins. Three of those veins – v001, v003 and v004 – are mined in the PEA. A fourth vein with strong gold grades, called v006b, is the third largest contributor of tonnes and ounces in the current mineral resource estimate (“MRE”) but was not included in the PEA mine plan because its data stems largely from historic drilling, which suffers from unsampled intervals. Historic operators often only sampled and assayed drill core with visible quartz veining. Surrounding rock, including vein margins, narrow gaps between veins, and adjacent wall rock, was not sampled. In the MRE estimation process those unsampled intervals were assigned a value of half detection limit (0.0025 gpt Au).
During the 2023 drill campaign, West Red Lake Gold demonstrated that gold mineralization regularly persists into the altered wall rock adjacent to high-grade gold veins. Selective sampling would have missed mineralization of this type.
Lack of assay coverage outside of narrow sampled vein intervals resulted in a heavily diluted v006b resource with insufficient continuity for mining. The Company believes there is good potential to upgrade and expand v006b with approximately 2,000 metres of new drilling to re-drill some historic holes while also testing some strong targets for expansion and is keen to complete this work and potentially bring v006b into mine plan consideration. The position of v006b is also fortuitous as this area is closer to the mine portal and access decline and could potentially bring earlier tonnes and ounces into the mine plan within the first 6 months of development.
The planned drill program also includes holes to upgrade the 37% of the resource tonnes in the PEA mine plan that are currently categorized as inferred. It is notable that 63% of the resource tonnes and 72% of the ounces mined in the PEA plan are already at indicated confidence. Together, the drill program to upgrade portions v001 and v004 from inferred to indicated and upgrade v006b continuity totals 3,500 metres.
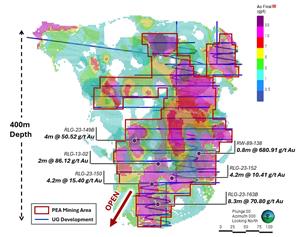
The next layer of opportunity at Rowan is based on expanding the deposit. Notably, the highest-grade intercept ever drilled at Rowan was achieved during the 2023 drill campaign when hole RLG-23-163B returned 70.8 g/t gold over 8.3 metres. This intercept came from the deeper portion of v001 and indicates potential for mineralization to continue, and perhaps strengthen, at depth. The Rowan vein system has only been defined down to approximately 400 metres and remains wide open for expansion at depth (Figure 2). The Rowan deposit also remains open along strike to the east and west.

Figure 2. Long section of Rowan block model at 1 gpt Au cutoff showing PEA mine design (blue) and outline of areas planned for long hole stoping (red outline). Notable assay intercepts have been highlighted to indicate the strength of gold mineralization and expansion potential at depth.
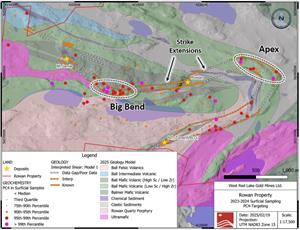
Additionally, West Red Lake Gold defined two new till anomalies at Rowan in 2024 that align spatially with deflections and folding in the main regional shear that hosts gold mineralization. These targets have seen very little previous drilling (Figure 3).

Figure 3: Till targets along trend from the Rowan deposit that were defined in 2024 and have seen very little drill testing.
Mining and Infrastructure
Rowan is planned as an underground operation mined by longhole stoping methods, tapping a deposit that is near vertical and averages 2 metres width.
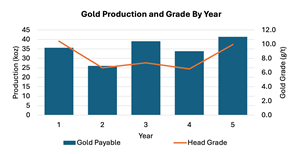
The site requires 1.4 kilometres of capital development (including remucks, sumps, and level access points) before first ore is accessed. The mine plan starts in a high-grade portion of the deposit close to surface, resulting in a 10.4 g/t gold average head grade in Year 1. Head grade ranges from 6.7 to 7.4 g/t gold in Years 2, 3, and 4 as mining progresses through different parts of the three veins – v001, v003 and v004 – that make up the mine plan.
In Year 5 the mine reaches the deepest part of the mine plan and the grade rises to 9.9 g/t gold. Annual gold production ranges from 26,090 oz. to 41,410 oz. based primarily on the variance in head grade.

Figure 4: Rowan Mine Gold Production and Gold Grade by Year
Material is moved out of the mine by truck.
A sampling tower will be used to measure the head grade before mined material is trucked off site for processing at a local mill.
Initial, Operating and Sustaining Capital
Initial capital needs are relatively evenly spread across three requirements: underground development to access mining areas, surface infrastructure, and equipment procurement. Capital spend estimates include a 30% contingency.
Surface infrastructure needs include a crusher, a sampling tower, polishing pond and water treatment plant, a waste rock facility, a mine dry facility, a small camp, a maintenance shop, and electrical infrastructure.
Operating costs were informed using the operating costs at mines in the area and include a 10% contingency.
A toll milling cost of $67.44 per tonne was assumed, based on first principle estimates as applied to toll milling agreements and knowledge of processing costs at mills in the vicinity.
Table 2: Capital and Operating Costs
| Initial Capex | ($M) | $70.4 | |
| Sustaining Capex | ($M) | $102.6 | |
| Reclamation Capex | ($M) | $3.2 | |
| Total Capex | ($M) | $176.2 | |
| LOM Cash Cost | (US$/oz) | $963 | |
| LOM All-in Sustaining Cost | (US$/oz) | $1,408 | |
Financial Analysis
The Rowan mine’s flagship characteristics are low capital costs and high gold grades. These attributes generate a toll milling mine plan with a 41.9% after-tax IRR and $42 million in expected average annual free cash flow.
Table 3: Key Operating, Cost, and Revenue Metrics at US$2,500 per oz. gold
| Total | Year 1 | Year 2 | Year 3 | Year 4 | Year 5 | |
| Mill throughput (t) | 705,185 | 109,885 | 125,348 | 169,964 | 166,417 | 133,571 |
| Average Grade (g/t) | 8.01 | 10.41 | 6.67 | 7.38 | 6.52 | 9.94 |
| Production (ozs) | 176,155 | 35,683 | 26,088 | 39,125 | 33,850 | 41,408 |
| Total Revenue ($M) | $593.9 | $120.3 | $88.0 | $131.9 | $114.1 | $139.6 |
| Operating Costs ($M) | $213.6 | $38.0 | $40.3 | $45.2 | $49.9 | $40.2 |
| Sustaining Capital ($M) | $102.6 | $33.9 | $34.0 | $34.3 | $0.3 | $0.0 |
| Pre Tax Cash Flow ($M) | $189.1 | $45.3 | $11.4 | $49.1 | $61.0 | $95.9 |
| Post-Tax Discounted Cash Flow ($M) | $125.3 | $44.2 | $10.6 | $35.9 | $41.8 | $65.6 |
| Average Annual Free Cash Flow ($M) | $39.6 | |||||
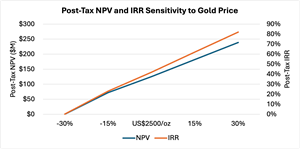
The financial outcomes of the Rowan mine plan are highly sensitive to the price of gold. A 15% increase in the gold price to US$2,875 per oz. lifts the post-tax NPV and IRR to $176 million and 50.5%, respectively. A 30% increase in the gold price to US$3,250 per oz. (close to current spot pricing) leads to a $232 million NPV and a 66.6% IRR.
Table 4: Post-Tax Net Present Value ($M) and IRR Sensitivity to Gold Price
| Gold Price | (30%) | (15%) | US$2,500/oz | +15% | +30% |
| NPV | $0 | $72 | $125 | $182 | $239 |
| IRR | 0.2% | 23% | 42% | 62% | 82% |

Figure 5: Post-Tax Net Present Value ($M) and IRR Sensitivity to Gold Price
Mineral Resource Estimate
The MRE for the Rowan Project is provided in Table 5, with an effective date of June 30, 2025. This estimate reflects non-material modifications to the mineral resource estimate in the previous technical report dated April 26, 2024.
Table 5: Mineral Resource Statement, Rowan Project, Red Lake, Ontario, effective date June 30, 2025.
| Category | Tonnage (t) | Average Grade (g/t Au) | Contained Metal (oz Au) |
| Indicated | 478,707 | 12.78 | 196,747 |
| Inferred | 421,181 | 8.73 | 118,155 |
Notes:
- CIM (2014) definitions were followed for Mineral Resources.
- Mineral Resources were estimated at a gold cut-off grade of 3.80 g/t using a long-term gold price of $1,800 USD per ounce.
- Density used for the estimation on all domains was set at 2.8 g/cm3.
- There are no Mineral Reserves currently estimated at the Rowan Project.
- Mineral Resources that are not Mineral Reserves do not have demonstrated economic viability.
- Mineral Resources are reported within vein wireframes at the stated cut-off grade of 3.80 g/t Au.
- The effective date of the Mineral Resources is June 30, 2025.
Qualified Persons
Grant Carlson. P.Eng. Fuse Advisors Inc. Professional Registration: Engineers and Geoscientists of British Columbia #39395. Area of Responsibility: mining and infrastructure
John Sims, P. Geo. Sims Resource LLC. Professional Registration: American Institute of Professional Geologists CPG-10924. Area of Responsibility: resource estimate and modeling.
Travis O’Farrell. P.Eng. Fuse Advisors Inc. Professional Registration: Engineers and Geoscientists of British Columbia #46026. Area of Responsibility: processing and metallurgy (and associated cost estimate)
Daniel Ruane, P.Eng. Knight Pie sold Ltd. Specialist Engineer. Professional Registration: Engineers and Geoscientists of British Columbia #42894. Area of Responsibility: waste rock and water management, site-wide water balance (and associated cost estimate)
AJ MacDonald. P.Eng. Integrated Sustainability Ltd. Professional Registration: Engineers and Geoscientists of British Columbia 45872. Area of Responsibility: water treatment.
Paul Hughes, PEng, PHC Inc. Professional Registration Engineers and Geoscientists of British Columbia #139365. Area of responsibility: underground geotechnical.
Technical Information
The PEA is preliminary in nature, includes inferred mineral resources that are considered too speculative geologically to have the economic considerations applied to them that would enable them to be categorized as mineral reserves, and there is no certainty that the PEA will be realized. The Company has not defined any mineral reserves for the Rowan Project. Mineral resources are not mineral reserves and do not have demonstrated economic viability.
For readers to fully understand the information in this news release, reference should be made to the full text of the Technical Report, once filed, including all assumptions, qualifications and limitations therein. The Technical Report is intended to be read as a whole, and sections should not be read or relied upon out of context.
The technical content of this press release has been prepared, reviewed, and approved by Mr. Will Robinson, P.Geo., Vice President Exploration of West Red Lake Gold Mines Ltd., and by Mr. Maurice Mostert, P.Eng., Vice President Technical Services of West Red Lake Gold Mines Ltd.
ABOUT WEST RED LAKE GOLD MINES
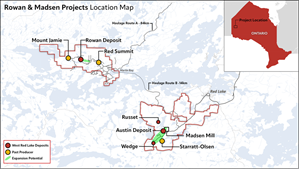
West Red Lake Gold Mines Ltd. is a gold mining company that is publicly traded and focused on operating and expanding its flagship Madsen Gold Mine, which is on a 47 km2 highly prospective land package in the Red Lake district of Ontario. The highly productive Red Lake Gold District of Northwest Ontario, Canada has yielded over 30 million ounces of gold from high-grade zones and hosts some of the world’s richest gold deposits. WRLG also holds the wholly owned Rowan Property in Red Lake, with an expansive property position covering 31 km2 including three past producing gold mines – Rowan, Mount Jamie, and Red Summit.

ON BEHALF OF WEST RED LAKE GOLD MINES LTD.
“Shane Williams”
Shane Williams
President & Chief Executive Officer
FOR FURTHER INFORMATION, PLEASE CONTACT:
Gwen Preston
Vice President Communications
Tel: (604) 609-6132
Email: investors@wrlgold.com or visit the Company’s website at https://www.westredlakegold.com
Neither the TSX Venture Exchange nor its Regulation Services Provider (as that term is defined in the policies of the TSX Venture Exchange) accepts responsibility for the adequacy or accuracy of this release.
CAUTIONARY STATEMENT AND FORWARD-LOOKING INFORMATION
Certain statements contained in this news release may constitute “forward-looking information” within the meaning of applicable securities laws. Forward-looking information generally can be identified by words such as “anticipate”, “expect”, “estimate”, “forecast”, “planned”, and similar expressions suggesting future outcomes or events. Forward-looking information is based on current expectations of management; however, it is subject to known and unknown risks, uncertainties and other factors that may cause actual results to differ materially from the forward-looking information in this news release and include without limitation, statements relating to the results of the PEA being achieved, the Technical Report being filed within 45 days (if at all) supporting the results of the PEA described in this news release; the significant of the results of the PEA; the ability of exploration activities, including drilling, to accurately predict mineralization; management’s expectations on the grade and extension of mineralization, the accuracy of results from prior exploration activities conducted at the Rowan Project; the key assumptions, parameters, and methods used to estimate the mineral resource estimate disclosed in this news release; the prospectus, if any, of the mineral deposits; the potential profitability and/or viability of the Rowan Project and the extent of the potential profitability; the capital and operating costs involved in the Rowan Project; the potential for expansion at the Rowan Project; and the Company’s future objectives and plans. Readers are cautioned not to place undue reliance on forward-looking information.
Forward-looking information involve numerous risks and uncertainties and actual results might differ materially from results suggested in any forward-looking information. These risks and uncertainties include, among other things, failure to identify mineral resources; failure to convert estimated mineral resources to reserves; the inability to complete a PFS or feasibility study which recommends a production decision; delays in obtaining or failure to obtain required governmental, environmental or other project approvals; political risks; inability to fulfill the duty to accommodate indigenous partners; uncertainties relating to the availability and costs of financing needed in the future; market volatility; the state of the financial markets for the Company’s securities; fluctuations in commodity prices; and changes in the Company’s business plans. Forward-looking information is based on a number of key expectations and assumptions, including without limitation, that the Company will continue with its stated business objectives and its ability to raise additional capital to proceed. Although management of the Company has attempted to identify important factors that could cause actual results to differ materially from those contained in forward-looking information, there may be other factors that cause results not to be as anticipated, estimated or intended. There can be no assurance that such forward-looking information will prove to be accurate, as actual results and future events could differ materially from those anticipated in such forward-looking information. Accordingly, readers should not place undue reliance on forward-looking information. Readers are cautioned that reliance on such information may not be appropriate for other purposes. Additional information about risks and uncertainties is contained in the Company’s management’s discussion and analysis for the year ended December 31, 2024, and the Company’s annual information form for the year ended December 31, 2024, copies of which are available on SEDAR+ at www.sedarplus.ca.
The forward-looking information contained herein is expressly qualified in its entirety by this cautionary statement. Forward-looking information reflects management’s current beliefs and is based on information currently available to the Company. The forward-looking information is made as of the date of this news release and the Company assumes no obligation to update or revise such information to reflect new events or circumstances, except as may be required by applicable law.
For more information on the Company, investors should review the Company’s continuous disclosure filings that are available on SEDAR+ at www.sedarplus.ca.
Photos accompanying this announcement are available at:
https://www.globenewswire.com/NewsRoom/AttachmentNg/362677af-faff-4569-a63e-3dc6ad91ca70
https://www.globenewswire.com/NewsRoom/AttachmentNg/043f1821-bd28-47a0-987a-582c330f0440
https://www.globenewswire.com/NewsRoom/AttachmentNg/a4a91a30-1f66-4233-b3fe-f0ea4e4d267e
https://www.globenewswire.com/NewsRoom/AttachmentNg/6dbf21a3-ac97-4a24-8559-65051c0ac6a8
https://www.globenewswire.com/NewsRoom/AttachmentNg/a9d18a7c-49e9-48d7-9016-1958e00028ce
https://www.globenewswire.com/NewsRoom/AttachmentNg/b9b8b202-8c20-4e7e-b27c-7080cd575c23


