
$MMY.v / OTC: $MMTMF) Strategic Share Buyback Analysis Report August 2026. Note this formatted better here: Darp101 on X: "Monument Mining, the Best Buyback Stock in the World? Yes, and it can 10 to 165 Bag Due to a 55% Free Cashflow Yield on EV and $102 Million in Cash Monument Mining Limited (TSXV: $MMY.v / OTC: $MMTMF) Strategic Share Buyback Analysis Report August 2026 MetricValue Share https://t.co/8Pkw15eV6s" / X
MetricValue Share Price$0.60 Shares Outstanding343 million
Market Capitalization$221 million Cash (no debt)$102 million
Annual Free Cash Flow$84 million (≈ $7 M / month)
EPS / Net Income$0.22 / ≈ $75.46 million P/E Ratio2.5×
Enterprise Value / EV/EBITDA$153 million / 1.38× Assumed Constant Gold Price$4,400 / oz
The company is deeply undervalued. In fact, out of over 30,000 stocks the author screened, Monument ranked first as the stock that would benefit more from a stock buyback than any other stock in the world. Large-scale tender offers (substantial issuer bids) under TSX rules permit rapid capital return beyond normal NCIB limits.
2. Key Modeling Assumptions • Monthly FCF = $7 million; annual Net Income held constant at $75.46 million unless noted. • First 40% tender completes 1 November 2026 at $0.68 (≈13% premium). Cost = $93.3 million. Cash used first. • After the initial tender + next $50 million of FCF buys, 100% of monthly FCF is used for buybacks (Paths 1–3). • All paths terminate on ≈ 1 August 2028 (the date Path 1 reaches 98% share retirement). • Path 5: $40 M CapEx over 12 months from Nov 2026; production from Nov 2027 at 15 koz/yr, $2,000 AISC → ≈ +$25 M annual NI/FCF. • Annual sales assumed ≈ $180 million for per-share illustrations.
3. The Paths
Path 1 — “Ineffective” Aggressive Buyback (Fixed $0.68) Market never re-rates; share price stays $0.60. 40% tender at $0.68, then +$50 M at $0.68, then 100% of monthly FCF retires shares at the fixed $0.68 until only 2% of original shares remain (6.86 million). Maximizes share count reduction. Endpoint: EPS $11.00 | 9× PE → $99.00 | Cash/share ≈ $3.00 (≈ $5 after two more months) Sales/share ≈ $26. This would happen in just 2 years.
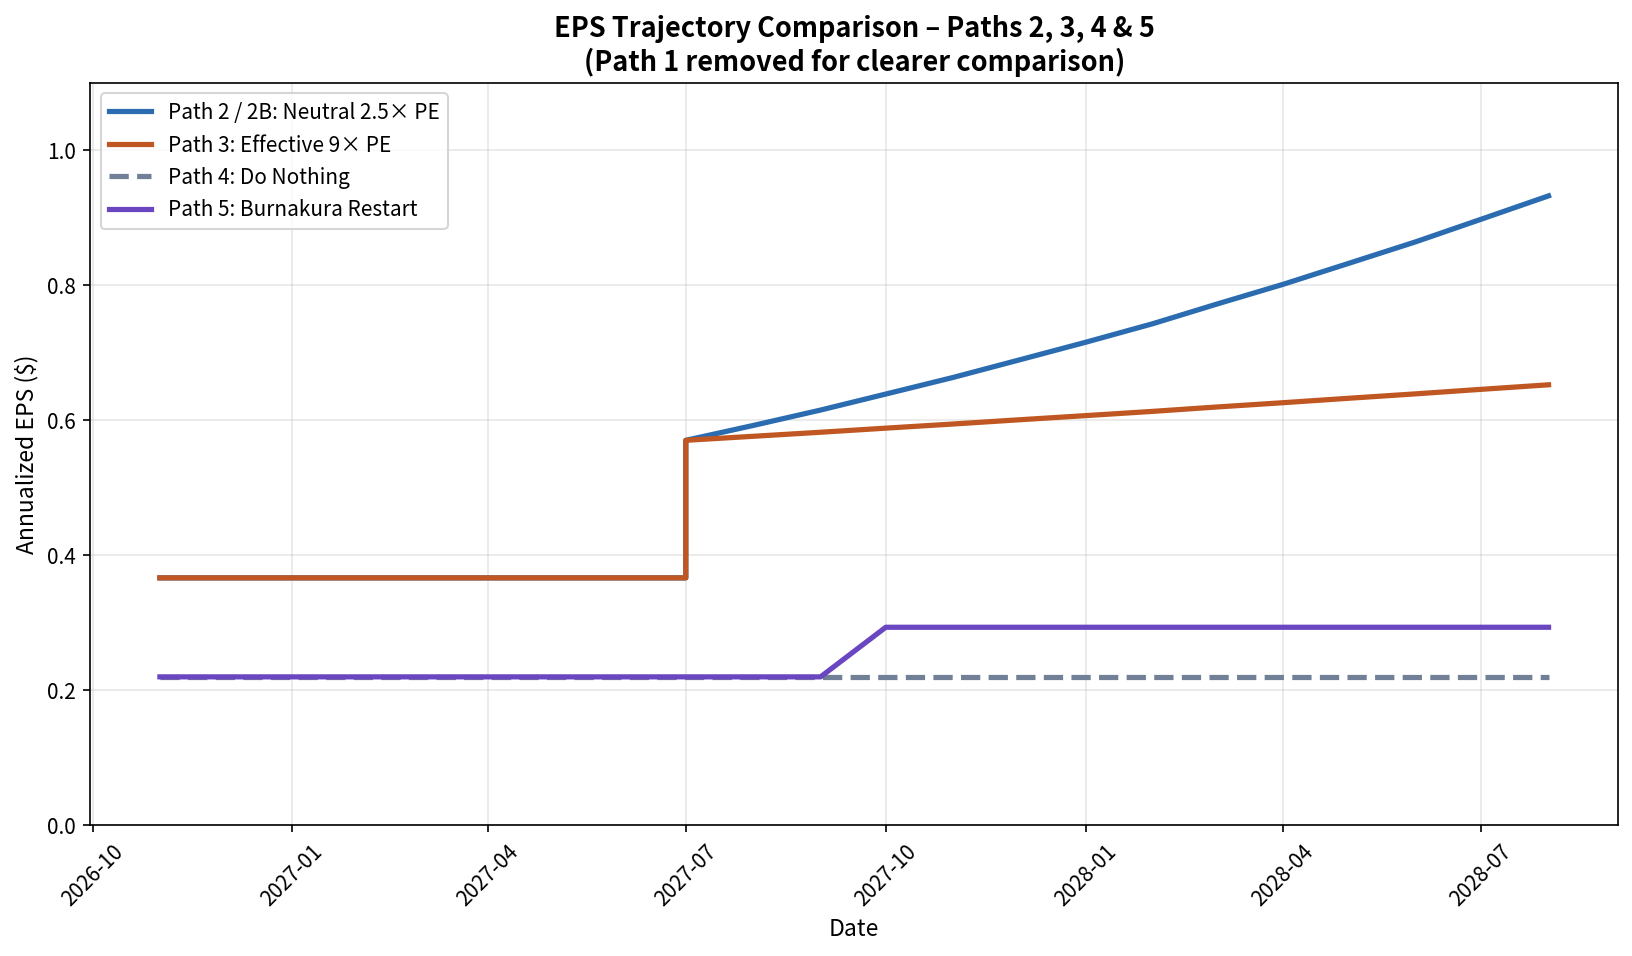
Path 2 — Neutral Valuation (Maintains 2.5× PE) Identical first tender + $50 M tranche at $0.68. Thereafter stock trades at constant 2.5× PE so buyback price rises with EPS; fewer shares are retired. (2.5X PE).Endpoint: Shares ≈ 80.9 M | EPS ≈ $0.93 | Price ≈ $2.33 Path 2B — Neutral + Terminal 9X PE Re-rating Identical to Path 2 during the program. At the August 2028 endpoint the stock is assumed to re-rate to 9× PE. Endpoint: Shares ≈ 80.9 M | EPS ≈ $0.93 | Price = $8.37 (9× PE).
Path 3 — Effective Buyback (Re-rates to 9× PE After Initial Tender) Same first two tranches at $0.68. Immediately after the $50 M buy the stock re-rates to 9× PE and tracks that multiple thereafter. Endpoint: Shares ≈ 115.6 M | EPS ≈ $0.65 | Price ≈ $5.87 (9× PE). Path 4 — Do Nothing No buybacks. All FCF accumulates as cash. Market cap rises by FCF generated; 2.5× PE maintained on earnings. Endpoint: Shares 343 M | EPS $0.22 | Price ≈ $1.07 | Cash ≈ $249 M.
Path 5 — Restart Burnakura The primary figure uses the 9× PE case. Primary Endpoint (9× PE): EPS ≈ $0.29 | Price = $2.64 per share | Multiple = 4.4×. (Conservative 2.5× PE case ≈ $0.73 per share | 1.2×.
4. Comprehensive Comparison Table (Endpoint ≈ 1 August 2028) PathDescriptionShares Left (m)Final EPSFinal PriceMultipleCAGR* 1Ineffective BB (fixed $0.68)6.86$11.00$99.00 (9×)165×≈ 1,243%
2Neutral (tracks 2.5× PE)80.9$0.93$2.33 (2.5×)3.9×≈ 99% 2BNeutral + terminal 9× PE80.9$0.93$8.37 (9×)14.0×≈ 282%
3Effective (to 9× after tender)115.6$0.65$5.87 (9×)9.8×≈ 219%
4Do Nothing343$0.22$1.071.8×≈ 34%
5Burnakura restart (9× PE)343$0.29$2.644.4×≈ 112% *CAGR calculated from current $0.60 (≈ mid-August 2026) to the August 2028 endpoint (≈ 1.97 years).
5. Why Path 1 Produces Dramatically Superior Returns 1. Maximum share retirement at the lowest price. Fixed $0.68 allows every FCF dollar to retire ≈ 1.47 shares. Rising prices in Paths 2/2B/3 shrink that number dramatically. Path 1 retires 98% of equity. 2. Explosive EPS accretion. Fixed earnings power divided by a 50× smaller share count produces $11.00 EPS. 3. Asymmetric upside for remaining owners. The “ineffective” program ends with EPS so high that any reasonable multiple (5–9×) produces a $55–$99 stock. Continuing shareholders own a far larger percentage of the same cash-flow engine. 4. Highest ROI on capital. Buybacks at a deep discount to intrinsic value convert low-yielding cash into permanent ownership reduction — superior to holding cash (Path 4) or a modest and quite profitable production expansion (Path 5). 5. Practical under TSX rules. Substantial issuer bids / tender offers allow rapid, large-scale retirement that normal NCIBs cannot match.
6. EPS Trajectory Charts Path 1’s explosive rise results purely from collapsing the share count while earnings power remains constant. All other paths produce only modest (or zero) EPS accretion. Figure 1 – See Bottom Figure 2 – Linear Scale (better for comparing Paths 2–5) See Bottom

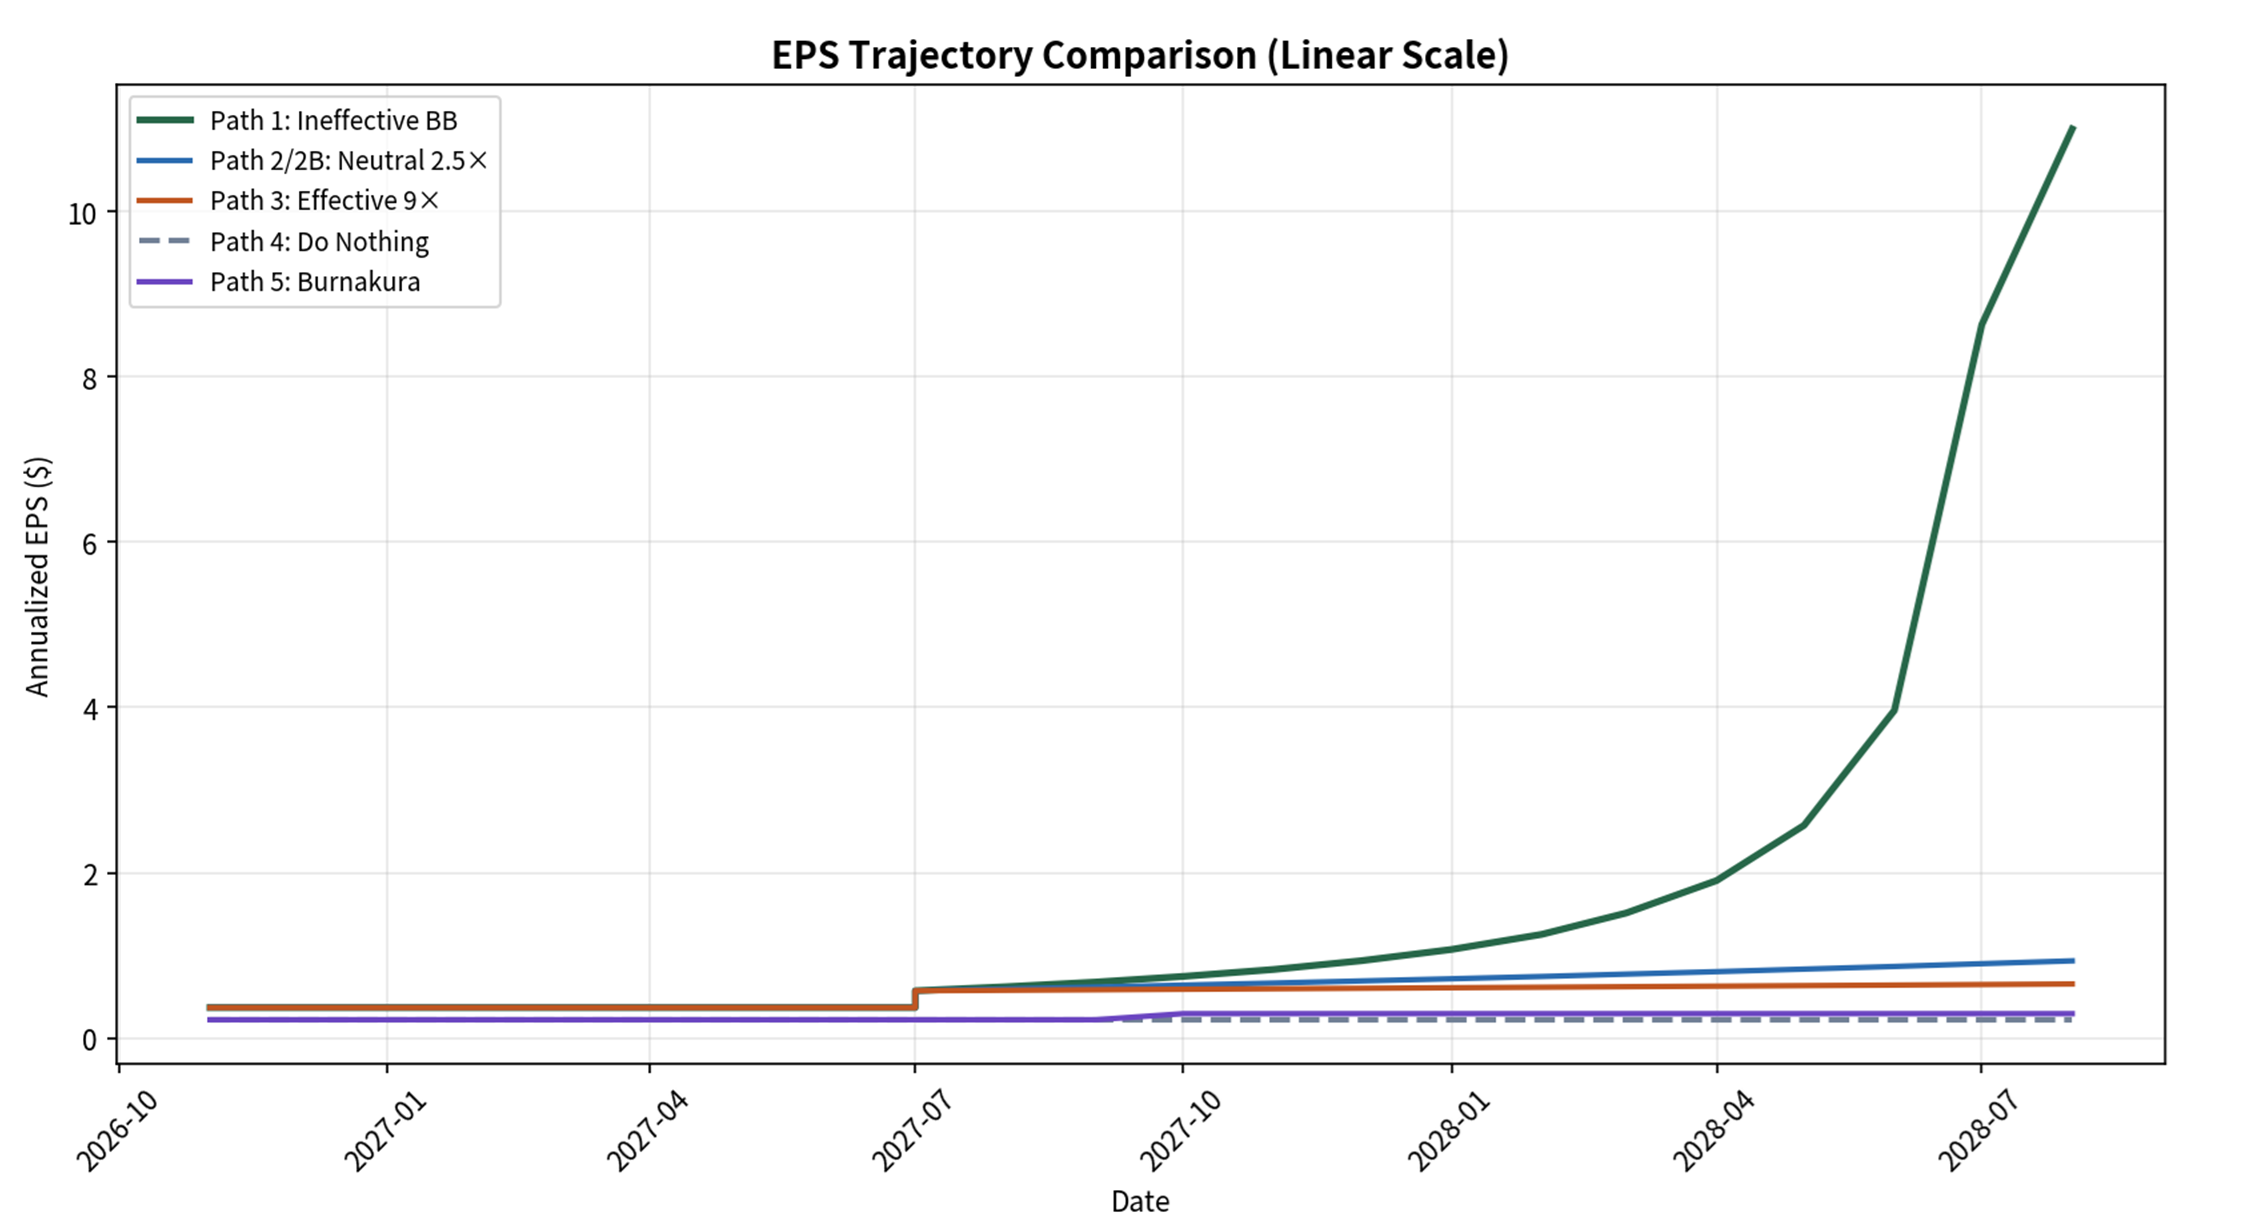
7. Conclusion At a 2.5× PE, $102 million net cash and $84 million annual FCF, Monument is the best candidate for aggressive capital return out of over 30,000 stocks the author screened. Path 1 (fixed-price “ineffective” buyback) produces by far the highest EPS, residual ownership stake, terminal equity value and shareholder CAGR.
Path 1 is unlikely if the market wakes up to the fact that Monument is in a position to skyrocket their EPS via buybacks. However if the stock market does not re-rate the PE over 9PE it is feasible for the company to retire 98% of its stock and achieve over $10.00 EPS, but with more time.
Path 2B and Path 3, which incorporate full or partial re-rating, deliver lower returns but still delivers outstanding retruns of 289% CAGR and 219% CAGR respectively, because higher purchase prices limit share retirement speed.
Paths 4 and 5 create the least amount of value. Management should prioritize a large tender offer as soon as practicable, followed by systematic retirement of the remaining float with free cash flow. The mathematics of share-count reduction at a deeply undervalued price create far more shareholder value than holding cash or deploying it into a new mine.
In fact to achieve Path1 type EPS results would require the company to buy about 9 Kalgoorlie Super Pit-scale mines, which would cost in the neighborhood of $100 billion dollars. This report is primarily about the incredibly good buyback aspect. For general info on Monument and their operations here is a newer video of the CEO. https://youtu.be/KJ7_fkgHfE8
— End of Report — Prepared for article use | Modeling as of Aug