

An Updated Framework for Understanding Mining Company Valuations Across Market Cycles
A Comprehensive Research Report
by Allan Barry Laboucan
Lab Report powered by CEO.ca
An evergreen reference document derived from the original Rocks and Stocks News video presentation
Homage to Pierre Lassonde — one of the true legends of the mining business
Executive Summary
The Lassonde Curve, developed by Pierre Lassonde, has served for decades as the mining sector's foundational model of how stock price and investor interest evolve across the life cycle of a mineral project. This paper presents a revised and extended version of that framework — the Lassonde Curve 2.0 — developed over 30 years of professional involvement in the mining sector and more than 20 years of research and commentary on mining equities.
The revision makes three principal contributions. First, it restores the original severity of the development discount window (the "valley of death"), which many contemporary renditions of the curve have inaccurately softened, and repositions the base of the right-side ascent into the late development stage to reflect observed market behavior. Second, it introduces three distinct post-production trajectories that determine long-term outcomes for producing companies. Third — and most significantly — it presents two versions of the curve: a Classic Version applicable to bear and neutral market regimes, and a Bull Market Version reflecting the systematic re-rating of every project stage that occurs during a secular metals bull market.
The central thesis of this paper is that a structural mispricing currently exists across the sector. Gold, silver, and copper prices are in bull markets, yet mining equities are being valued using metrics calibrated to a prior price regime — sub-US$2,000 gold, sub-US$40 silver, and sub-US$3 copper. Analysts, institutions, and retail investors are, in effect, applying the Classic Version of the curve in conditions that warrant the Bull Market Version. The gap between the two frameworks represents both the scale of the mispricing and the scale of the opportunity.
The paper also identifies two structural constraints that artificially lengthen and deepen the most difficult stages of the curve — mandated conservatism in economic studies under National Instrument 43-101, and protracted permitting timelines — and recommends that both be re-examined in light of the strategic importance of new mine supply. Six case studies illustrate the practical application of the framework.
1. Introduction
Pierre Lassonde is rightfully regarded as a legend of the mining business. As co-founder of Franco-Nevada — a success in its original incarnation, which was acquired by Newmont, and again in its second — and as one of the sector's most astute investors, his influence on how the industry thinks about value is difficult to overstate. His most widely used contribution to investment practice is the curve that bears his name: a stylized mapping of stock price and investor interest against the stages of a mineral project's life.
Over more than two decades as a researcher, reporter, and market commentator, and drawing on over 30 years in the mining business under the mentorship of accomplished geologists, geochemists, and geophysicists, I have used the Lassonde Curve as the first analytical filter applied to every company I evaluate. What I had not done, until now, is formalize how I use it — the adjustments I make, the regions of the curve where I concentrate attention, and the way the entire framework transforms under different market regimes.
This paper formalizes that methodology. It is offered as an homage to Mr. Lassonde's original insight and as a practical extension of it for the market conditions now taking shape.
2. Scope and Method
The framework presented here is qualitative and observational. It is not a pricing model; it is a positioning model. Its purpose is to answer two questions about any mining company: where does this company sit on the project life cycle, and is its valuation consistent with that position under the prevailing market regime? Valuation ranges cited throughout are indicative reference points drawn from observed market behavior across multiple cycles, including the 2001–2011 metals bull market, rather than outputs of a formal model.
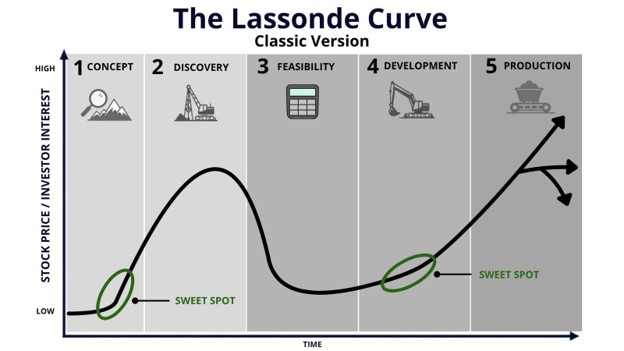
Two charts accompany this paper and constitute its core exhibits. Figure 1 presents the Classic Version of the Lassonde Curve 2.0, applicable in bear and neutral market regimes. Figure 2 presents the Bull Market Version. The two figures are intended to be read side by side: they depict the same life cycle under two different valuation regimes.
3. The Classic Version
3.1 The Five Stages
The curve divides the life of a mining company into five stages. In the concept stage, a company is developing an exploration target or conducting initial drilling on it. In the discovery stage, a meaningful discovery propels the company up the left side of the curve; in a bear-to-neutral regime, a high-quality project typically peaks at a valuation of US$1–2 billion, with the peak adjusting downward — to the order of US$500 million — for discoveries of lesser quality. The feasibility stage encompasses mineral resource estimation, preliminary economic assessment, and feasibility study work, and coincides with the descent into the development discount window discussed below. The development stage covers permitting, financing, and construction. The production stage begins as the operation comes online and the company ascends the right side of the curve.
3.2 The Development Discount Window
A survey of contemporary renditions of the Lassonde Curve — readily assembled through an image search — reveals a consistent distortion: the trough between discovery and production, which Lassonde termed the development discount window, is frequently drawn shorter in duration and shallower in depth than the original, and than reality.
This softening is analytically dangerous. The development discount window can persist for 10 to 20 years. Companies have published initial resource estimates and, many years later, still not completed economic studies on them. A commonly raised counterpoint — that a maiden resource estimate can establish a valuation base from which a stock advances — describes an outcome observed in perhaps 2–5% of cases. In the remaining 95%, the commencement of resource estimation and economic study work marks the beginning of the descent. The Classic Version presented here restores the window to its original severity because that severity is empirical.
3.3 Adjustment to the Right-Side Base
One deliberate departure from the original curve concerns the geometry of the recovery. In Lassonde's rendering, the valley extends as a prolonged flat section before a second peak rises. Observation across multiple cycles indicates that the market's re-rating does not occur as a discontinuity at first production; it can begin earlier, in late feasibility and development, as production visibility improves. Accordingly, the base of the right-side ascent in Figure 1 has been drawn back into the development stage.
3.4 The Two Sweet Spots
Two regions of the curve, marked with green ellipses in Figure 1, offer the most favorable asymmetry and account for the majority of the companies on my radar screens.
The first sweet spot lies at the inflection between concept and discovery, where drilling — the "truth machine" — is beginning to confirm a target before broad market recognition. The second sweet spot lies at the base of the curve, where a company is completing feasibility and entering development, ahead of the right-side ascent. It bears noting that a substantial portion of Pierre Lassonde's own investment success was achieved by identifying companies in this second region prior to production.
Two adjacent situations also merit attention. Companies whose fundamentals warrant a position well up the left side of the curve, but which remain priced near its base, represent recognizable mispricings. And the broader feasibility-and-early-development trough is acquiring structural importance: across gold, silver, and copper, the industry's pipeline of quality projects in these stages is thin relative to prospective demand, giving the entire window significant re-rating potential. Section 5 quantifies what that re-rating looks like.
3.5 Post-Production Trajectories
The three arrowheads on the right side of Figure 1 are an addition to the original framework. Upon reaching production, companies follow one of three trajectories, and distinguishing among them prospectively is among the most consequential judgments an investor can make.
Trajectory one — sustained growth. The company converts its first mine into a platform: continuing to make discoveries, advancing a pipeline, and compounding from junior miner to mid-tier and potentially to major. Barrick — American Barrick in its early years — under founder Peter Munk exemplified this trajectory during its ascent, before hedging practices and management decisions produced a prolonged period of underperformance in later years; the full arc is instructive in both directions. Agnico Eagle exemplifies the durable form of this trajectory: consistent execution, cost discipline, and pipeline strength sustained over decades.
Trajectory two — plateau. A single-mine company without pipeline development trades sideways within a healthy range for an extended period, then declines as production tails off, returning to the beginning of the curve.
Trajectory three — peak and decline. A single-mine company encountering operational challenges, with no pipeline, peaks and descends the far side of the curve as its mine depletes.
My methodology avoids trajectory three, allocates minimal attention to trajectory two, and concentrates on identifying prospective trajectory-one companies. A note on terminology: within this framework, "junior" is reserved for junior miners — companies in production with the capacity to grow. Explorers and developers are classified by their stage, not grouped under the junior label.
3.6 Stage-Consistent Comparison
The framework's principal discipline is that valuation comparisons are only meaningful within a stage. Expecting a production-scale valuation for a modest concept, or benchmarking a second-sweet-spot developer against a company with a world-class left-side discovery, constitutes a category error — a round peg in a square hole. Establishing a company's position on the curve is therefore the precondition for any valuation judgment.
4. The Present Sentiment Disconnect
At the time of writing, gold trades near US$4,100 per ounce, silver around US$60 and copper near record highs. By the evidence of the metals themselves, a secular bull market in gold, silver, and copper is underway. The equities, however, are priced with the sentiment of a bear market.
The dynamic can be visualized as a ball held underwater. In bear conditions, only a fraction of the ball — perhaps a quarter — remains above the surface; at sentiment extremes, the entire ball is submerged and driven deeper. The suppressed portion represents the gap between metal prices and equity valuations. Such conditions do not resolve toward equilibrium gradually; when the pressure releases, the adjustment is rapid and forceful. The Bull Market Version of the curve describes the environment on the other side of that release.
5. The Bull Market Version
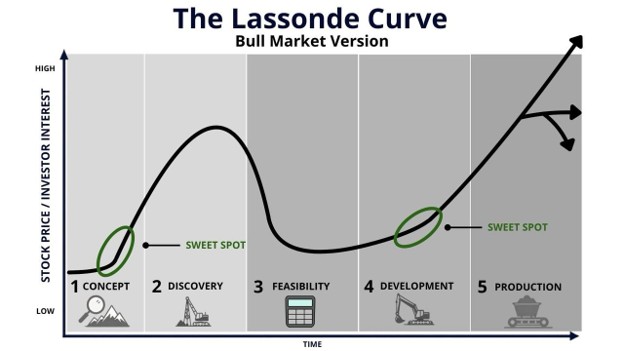
Two features distinguish Figure 2 from Figure 1, and both are substantive rather than cosmetic. The stage labels have been moved to the bottom of the chart because the curve itself now occupies the vertical space they held — a direct representation of regime change. And the curve's origin sits materially above the "low" marking on the price/interest axis: in a bull regime, every stage of the life cycle re-rates.
5.1 Stage-by-Stage Re-Rating
Table 1 summarizes indicative valuation ranges by stage under the two regimes, based on observed behavior in prior cycles, most notably 2001–2011.
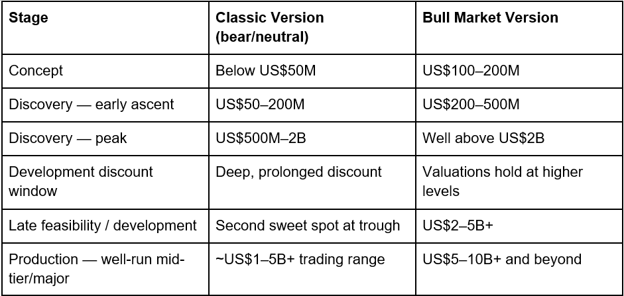
The production-stage figures warrant elaboration. In the bull regime, the top trajectory — the well-run mid-tier or major with cost discipline and a strong pipeline — trades into ranges that the classic regime reserves for the sector's largest companies, and the exceptional cases exceed the chart entirely. Among majors, Agnico Eagle has served as my reference example of this trajectory since early 2024; Newmont was added to my radar screens more recently on the assessment that its restructuring moves have brought it closer to the Agnico Eagle model. The plateau and decline trajectories persist in a bull regime, but play out at correspondingly higher levels.
5.2 The Metrics Problem
The practical significance of maintaining two versions of the curve is this: the analytical infrastructure of the sector — the comparable multiples, the price decks, the rules of thumb employed by analysts, commentators, and investors both institutional and retail — remains calibrated to the prior regime of sub-US$2,000 gold, sub-US$40 silver, and sub-US$3 copper. Those calibrations correspond to the Classic Version. Metal prices, however, have already migrated to levels consistent with the Bull Market Version.
The sector is, in effect, marking bull-market assets to a bear-market map. This paper's contention is that market participants should already be transitioning to Bull Market Version metrics, and that the persistence of legacy metrics constitutes a systematic, sector-wide mispricing — one that creates commensurate opportunity for investors who recognize it.
6. Structural Constraints on the Feasibility and Development Stages
Two of the most difficult stretches of the curve — feasibility and development — are lengthened and deepened by structural factors external to the companies traversing them. Both merit policy attention.
6.1 Mandated Conservatism in Economic Studies
Under the prevailing regulatory regime, companies preparing resource estimates, preliminary economic assessments, and feasibility studies are required to construct base-case scenarios on conservative metal price assumptions — in practical terms, to undervalue their own projects. Sensitivity analyses are permitted, but even the upper bound of allowable sensitivity cases must employ prices significantly below the prevailing metals prices.
The protective intent of these requirements is understood. Their standard justification — that trailing three-to-five-year average prices produce "accurate" valuations — does not withstand scrutiny in a structurally bullish supply-demand environment. Discounting future cash flows at a deliberately conservative future price does not produce accuracy; it produces systematic, unidirectional error. Mines are not financed or built on historical prices; they are built on current and future prices.
The consequence is not confined to the feasibility trough itself. A company's exit valuation from feasibility directly conditions its cost of capital entering development. Conservative study economics therefore translate into punitive dilution during construction financing — an outcome in which rules designed to protect investors instead punish them. On this basis, the reporting standards of National Instrument 43-101 warrant review, with particular attention to the price assumptions companies are compelled to use in base cases and sensitivities.
6.2 Permitting Duration
The development stage is further extended by permitting timelines that lie entirely outside corporate control. Where governments require protracted periods to permit significant mines, the development discount window persists accordingly. The valley of death cannot be dismissed as sentiment; a substantial portion of its length is administrative.
6.3 Supply Implications
These constraints carry consequences beyond equity markets. Mining is foundational to every industry and every manufactured product of modern life, and prevailing structural changes in the global economy demand both greater metal supply and greater security of that supply — in copper, silver, gold, and other metals. An industry that systematically undervalues its development pipeline while permitting regimes to extend its timelines is an industry that will underdeliver the supply the world requires. The recommendations follow directly: permitting regimes should be accelerated to match the strategic importance of new mine supply, and the mandated conservatism of economic studies should be revisited.
7. Applications of the Framework
7.1 Methodological Note: Radar Screens
The companies discussed below are drawn from my radar screens — specifically the category I designate unicorns. A definitional clarification is warranted, and reflects a permanent change in my practice. These lists have at times been construed as buy recommendations despite consistent disclaimers to the contrary. They are not.
They are screening outputs: companies filtered, on the basis of three decades of sector experience, into categories that merit independent investigation. I function as an idea generator. I am not a licensed broker, I hold no knowledge of any reader's risk profile, and I make no buying or selling recommendations. Readers should conduct their own due diligence and consult their financial advisors before making any investment decision.
7.2 Vizsla Silver
Position on curve: development stage, second sweet spot. Vizsla Silver has completed the left side of the curve and advanced into development, where it has executed a structurally significant de-risking step: construction of a production-sized underground decline to extract a bulk sample. The decline is the same infrastructure that will serve the production phase, and the bulk sample will be stockpiled as the first mill feed upon startup. The company has thereby pulled forward — and already funded — a portion of its development costs, and holds approximately US$400 million in treasury against mine construction, with final production permits outstanding. This is the second sweet spot in near-textbook form.
7.3 McEwen Inc.
Position on curve: production, feasibility, and development simultaneously; priced as a developer. McEwen holds assets across three stages of the curve concurrently. It produces gold and silver — at costs classifying it, on a gold-equivalent basis, as a high-cost producer, though prevailing gold prices sustain healthy margins even at that cost position. The framework's relevant insight is that high-cost producers are not equal: those with development-stage projects capable of growing production and reducing unit costs possess a path up the production curve that pure high-cost operators lack.
McEwen additionally holds, in feasibility, one of the world's most significant undeveloped copper assets: Los Azules, with a multi-decade projected mine life and projected production costs of US$2.11 per pound against a current copper price of over US$6.00 — a margin of exceptional width in a market structurally short of copper development projects. On the copper asset alone, the framework would position the company well up the curve; incorporating the producing gold platform and its growth profile strengthens that conclusion. The market nonetheless prices McEwen deep in the development discount window. The divergence between framework position and market position is the case study's central finding.
7.4 Goliath Resources
Position on curve: priced at concept; framework position well up the left side. Goliath Resources holds the Surebet discovery in British Columbia's Golden Triangle. The relevant precedent is Pretium Resources, whose Brucejack discovery I identified early and followed through to an acquisition in the billions of dollars; the Brucejack mine now operates as one of Newmont's tier-one assets. My assessment is that Surebet is of comparable — potentially greater — significance than Brucejack at the equivalent stage.
Current valuation, however, positions Goliath at the conceptual stage, at the entry of the first sweet spot. The framework position, on the quality of the discovery, is substantially higher on the left side, with realistic potential toward a premium discovery-peak valuation. An extended assay stream from active drilling is scheduled through the end of 2026, providing continuous tests and answers to the thesis.
7.5 Amex Exploration
Position on curve: feasibility/development, second sweet spot. Amex Exploration's Perron project in Quebec, followed since its grassroots discovery, has advanced into feasibility and development. As with Vizsla, the company is constructing production-sized infrastructure ahead of a production decision: an underground ramp to extract a 40,000-tonne bulk sample from an area averaging approximately one-half ounce of gold per tonne — a grade at which bulk sampling is functionally small-scale mining, with the free cash flow arithmetic left to the reader. The ramp's completion in 2027 means that when Perron enters full production within an estimated three-to-four-year horizon, this early infrastructure is already built and paid for. The framework places Amex in the second sweet spot.
7.6 New Found Gold
Position on curve: second sweet spot (arguably earlier), with trajectory-one potential. New Found Gold's Queensway discovery in Newfoundland carried the company to a discovery-peak valuation nearing CAD$2 billion before the customary descent through resource estimation into the development discount window. The company's conduct within the valley is the instructive element: a management transition introducing substantial mining experience, and acquisition of a mill carrying near-term production from its host project — while the principal driver, Queensway itself, advances toward production.
Queensway's distinguishing characteristic is grade. The contemporary open-pit gold industry operates predominantly at approximately 0.5 grams per tonne, generating strong economics through bulk tonnage of 20,000–30,000 tonnes per day. Queensway presents open-pittable material grading from nine grams per tonne to bonanza levels — enabling selective, surgical open-pit extraction of high grade rather than bulk mining, with underground potential in addition, while continued drilling and the mining itself progressively validate and expand resources and reserves. The framework assessment is decade-scale production potential and a credible trajectory-one path toward mid-tier status or beyond, contingent on management execution.
7.7 Contango Silver & Gold
Position on curve: priced at the development trough; framework position on the right-side ascent. Contango entered the unicorn category through its acquisition of Dolly Varden Silver, previously a radar screen company — a transaction assessed here as highly favorable to the combined entity. The company holds approximately US$100 million in cash, with estimated free cash flow generation on the order of US$100 million in each of 2026 and 2027, and a portfolio spanning feasibility and development — the Dolly Varden assets positioned squarely in the second sweet spot — with three distinct growth engines in total.
The framework identifies a company possessing the balance sheet, cash generation, and pipeline characteristic of an early trajectory-one compounder, priced as though stationary at the development sweet spot with no right-side ascent begun. That combination — trajectory-one capacity at trough pricing — defines the unicorn designation.
8. Implementation
The two figures presented in this paper are henceforth standing instruments of my published research. On the Lab Report powered by CEO.CA — airing Monday through Thursday on CEO.CA's official YouTube channel, comprising a market overview and deep-dive segments on companies reporting significant news — company analyses will be accompanied by explicit positioning on the Classic Version of the curve. The program's residence on the CEO.CA platform is deliberate: consistent with this paper's repeated emphasis on independent due diligence, CEO.CA is, in my assessment, the sector's most important venue for conducting that homework.
9. Conclusion
The Lassonde Curve 2.0 extends a foundational industry framework in three respects: restoration of the development discount window's true severity alongside a repositioned right-side base; explicit modeling of divergent post-production trajectories; and — centrally — the articulation of two regime-dependent versions of the curve. The metals market has already transitioned to conditions warranting the Bull Market Version; the sector's valuation practices have not. Until that transition completes, the distance between Figure 1 and Figure 2 is a measure of opportunity — and when suppressed sentiment releases, as it did across 2001–2011, investors positioned with the correct map will be the beneficiaries.
Disclosures and Disclaimer
The author does not make buying or selling recommendations and is not a licensed broker or investment advisor. All companies discussed are drawn from the author's radar screens, which are idea-generation lists compiled from the author's 30-plus years of experience in the mining sector, and are presented solely as candidates for readers' independent research. Nothing in this document constitutes investment advice. Readers should conduct their own due diligence and consult a qualified financial advisor before making any investment decision.
© Lab Report - Powered by CEO.CA. All rights reserved.

Lab Report - Powered by CEO.CA
For ongoing application of the Lassonde Curve 2.0 framework, follow the Lab Report on the official CEO.CA YouTube channel and conduct your homework on CEO.CA.