

The Lassonde Curve 2.0 Is An Updated Framework For Understanding Mining Company Valuations Across Market Cycles
by Allan Barry Laboucan (founder of Rocks And Stocks News and the Lab Report powered by CEO.CA)
Lab Report powered by CEO.CA
An evergreen reference document derived from the original Rocks and Stocks News video presentations.
Homage to Pierre Lassonde — one of the true legends of the mining business
Executive Summary
The first paper in this series (The Lassonde Curve 2.0, July 27, 2026) introduced a revised, two-regime formulation of Pierre Lassonde's foundational framework: a Classic Version applicable in bear and neutral markets, and a Bull Market Version in which every stage of the project life cycle re-rates. This second paper extends that work in three directions.
First, it sharpens the comparison between the two versions and locates the present market within them. The assessment is unambiguous: despite gold reaching approximately US$5,500 per ounce earlier this year before retracing to roughly US$4,000, and silver touching approximately US$120 before settling above US$60, mining equities remain valued on metrics calibrated to US$1,500–2,000 gold and sub-US$35 silver. The sector is trading on the Classic Version of the curve amid metal prices that warrant the Bull Market Version. Sentiment never joined this bull market in the manner observed during the 2001–2011 metals bull market — and that contrast is itself the opportunity.
Second, the paper presents the macroeconomic case for why the transition to the Bull Market Version is, in the author's assessment, not merely possible but structurally inevitable. The argument rests on the unsustainable arithmetic of global sovereign debt — approximately US$325 trillion worldwide, with U.S. federal debt near US$40 trillion and annual servicing costs trending toward US$1.5–2 trillion — set against sustained, structural central bank gold accumulation that has already lifted official gold holdings above U.S. Treasury holdings and above the Euro in reserves. The author's standing forecast, first published in 2024, of US$20,000 gold within ten years is maintained. Complementary structural cases are presented for silver, running a persistent annual supply deficit of 150–200 million ounces against roughly 800 million ounces of mine production, and for copper, the most critical of all metals, where the author's assessment is that US$10–15 per pound will be required against a current price near US$6.25.
Third, the paper applies the framework to ten companies from the author's Top of Mind radar screen, illustrating in each case the divergence between framework position and market position — including the observation that even the sector's best operators are mispriced under prevailing sentiment.
1. Introduction
The first paper in this series formalized a methodology: a restoration of the Lassonde Curve's original severity during the development discount window, an extension of its post-production geometry, and — centrally — its articulation into two regime-dependent versions.
The reception of that work, in both its video and written forms, confirmed an appetite in the market for stage-based valuation discipline, and the framework has since been placed into daily service: on the Lab Report powered by CEO.CA, every company deep dive now concludes with an explicit classification of where the company plots on the curve.
This paper serves two purposes. The first is analytical: to develop more fully the comparison between the Classic and Bull Market versions and to present the macroeconomic case for why the transition between them lies ahead. The second is applied: to extend the case study program from the Unicorns radar screen, covered in Part I, to the Top of Mind radar screen.
A definitional note carried forward from Part I: all valuations discussed in this framework are market values — shares outstanding multiplied by share price. The curve is a map of market capitalization against project stage.
2. The Two Versions Restated
Figures 1 and 2 — the Classic Version and Bull Market Version of the Lassonde Curve 2.0 — accompany this paper as they did Part I, and the reader is referred there for the full stage-by-stage exposition. The essentials, restated:
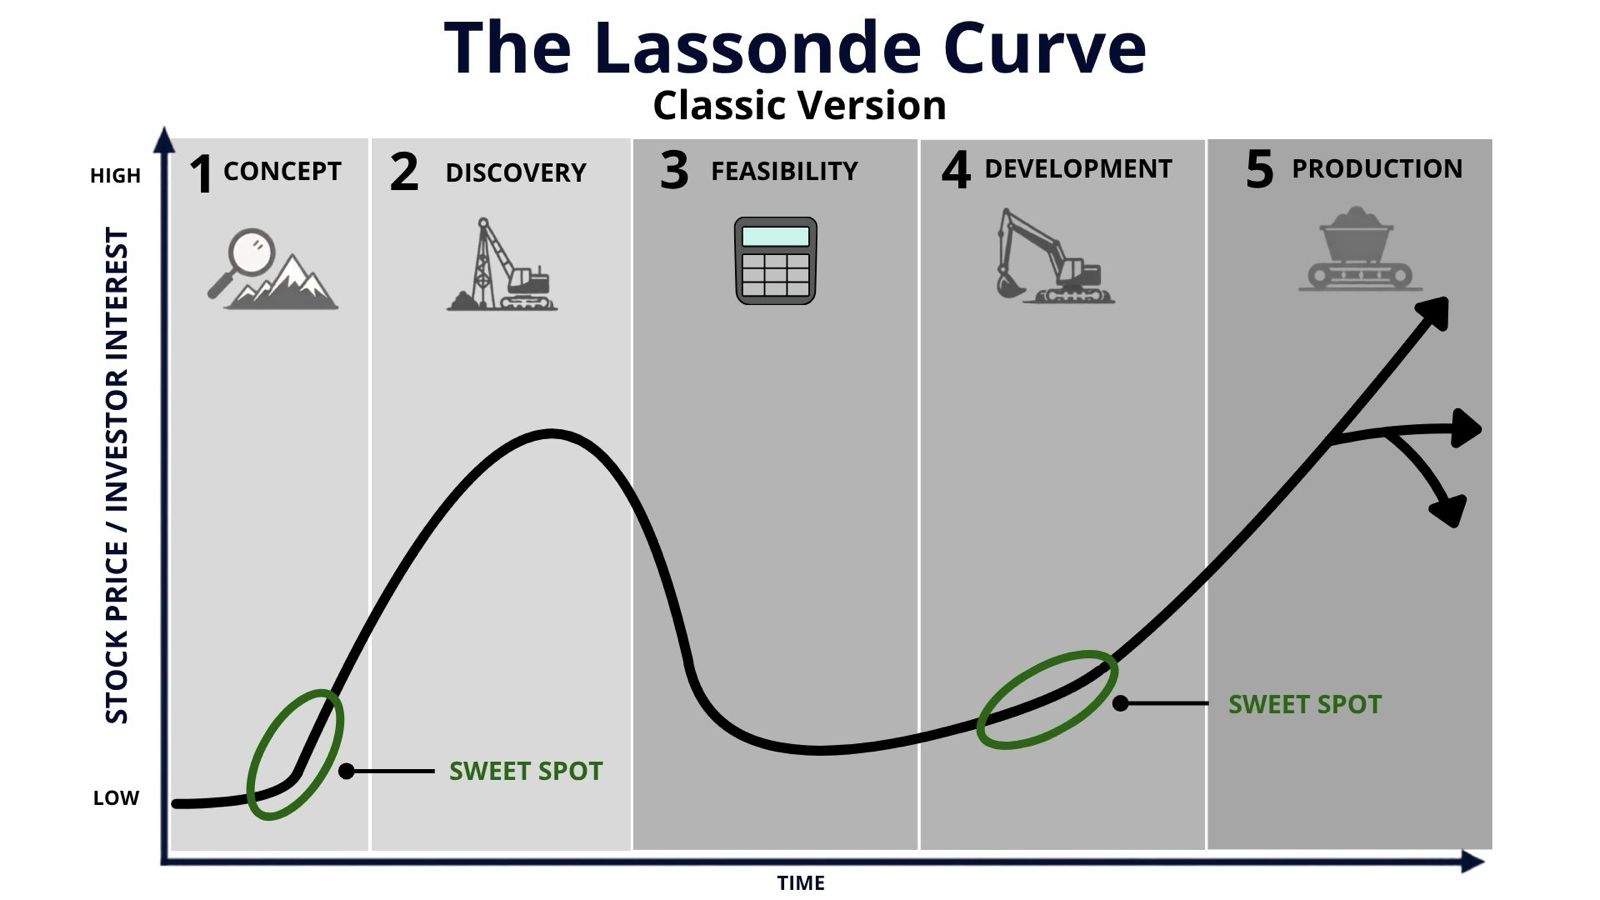
[FIGURE 1: The Lassonde Curve — Classic Version] Figure 1. The Lassonde Curve 2.0, Classic Version, applicable in bear and neutral market conditions.
The Classic Version restores the development discount window — Lassonde's valley of death — to the length and depth he originally described, against the modern tendency to draw it short and shallow. It marks the two sweet spots where this methodology concentrates: explorers immediately before or after discovery, and companies in late development before the right-side ascent. In this regime, the discovery peak on the left side of the curve generally falls between US$500 million and US$1–2 billion, with the US$2 billion level reserved for the Tier-1 world-class discovery.
The three post-production arrows complete the geometry. A single-mine producer that fails to replace mine life descends as its deposit depletes. A producer of one or several mines with mediocre execution oscillates within a trading range along a sideways trend. And the well-run company — replacing ounces, extending mine life, mining well — ascends and remains elevated.
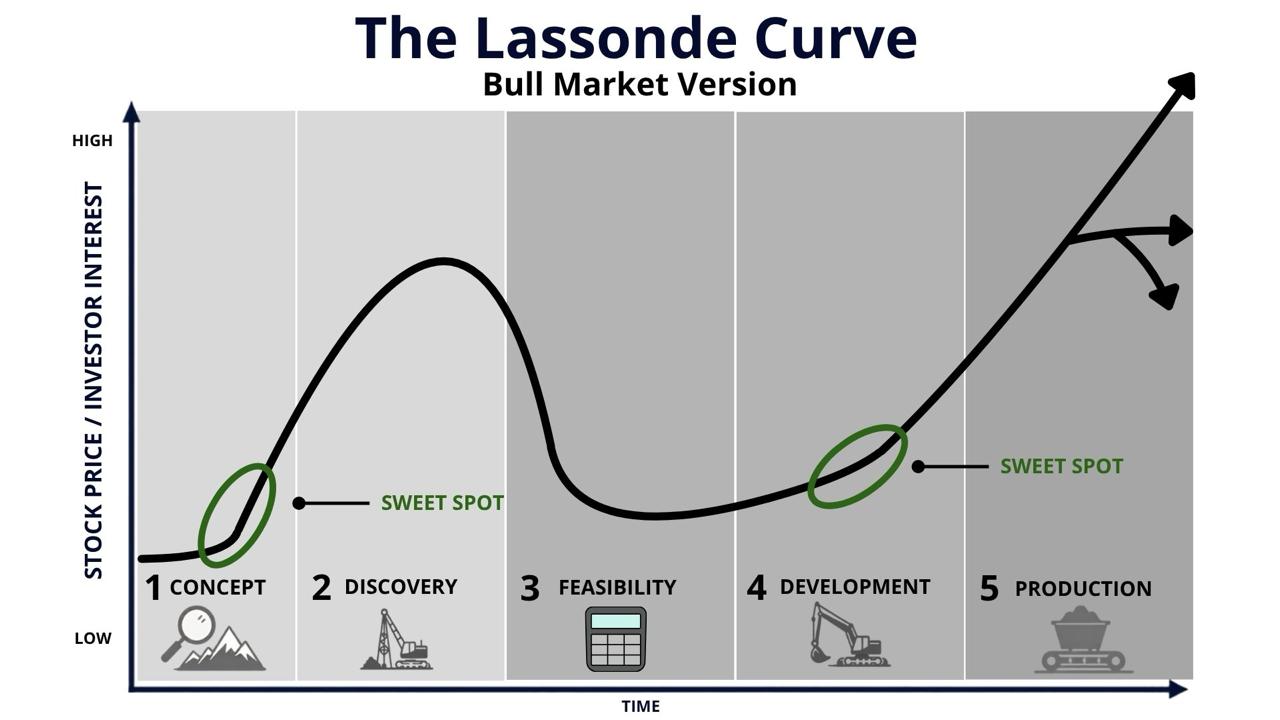
[FIGURE 2: The Lassonde Curve — Bull Market Version] Figure 2. The Lassonde Curve 2.0, Bull Market Version. Stage labels appear at the base of the chart because the elevated curve encroaches on their Classic Version positions.
In the Bull Market Version, the entire curve lifts. The conceptual stage begins not below the "low" axis marking but on the order of 15% of the way toward "high." The discovery peak for explorers with great projects extends into the US$1–5 billion range. The development discount window and the second sweet spot sit materially higher. The three trajectories persist — depleting single-mine producers still decline, mediocre operators still range-trade, though within significantly higher bands — and the best miners move off the chart and remain there for extended periods.
The stage labels themselves tell the story: they were moved to the bottom of Figure 2 because the elevated curve encroaches on the space they occupy in Figure 1. The version change is visible in the chart's own architecture.
3. Locating the Present Market
Where does the market stand today between these two maps? The author's assessment, grounded in three decades of evaluating companies and two decades of tracking their valuations as a commentator, is that we remain squarely on the Classic Version — in bear-to-neutral sentiment — despite bull-market metal prices.
The evidence of the metals is not ambiguous. Gold has made a series of record highs since the first quarter of 2024, peaking near US$5,500 earlier this year before selling off to approximately US$4,000 — a level that remains higher year-over-year. Silver reached approximately US$120 and continues to trade around US$60.
Yet the retracement returned equity sentiment to levels consistent with US$1,500–2,000 gold and sub-US$35 silver. Even at the sentiment high-water mark early this year, valuations never reflected prevailing metal prices; the equities never joined this bull market in any substantial way — not in the manner witnessed across the 2001–2011 metals bull market, the last period in which the Bull Market Version of the curve was fully expressed in metals stock valuations.
It bears emphasis that the 2001–2011 valuations were themselves achieved on gold prices that peaked near US$2,000. Today's metal prices are double of that era's, while equity valuation practice has not moved. This is the metrics problem identified in Part I, observed now at greater extremity.
The disconnect extends to the highest-quality companies in the sector. Agnico Eagle — the reference case, in this framework, for the top post-production trajectory — trades at a valuation that, measured against its free cash flow generation and pristine balance sheet, belongs well up the right side of the curve and heading off the chart. It is priced far below that.
When the best operator in the industry is mispriced, the condition is systemic. And systemically weak sentiment, in this framework, is a terrific value proposition.
4. The Macro Case for the Bull Market Version
The claim that the Bull Market Version lies in the near future is not a sentiment call. It rests on structural arguments in each of the three metals this research program covers.
4.1 Gold: The Debt Death Spiral and the Modern Gold Standard
Central banks worldwide have accumulated gold to the point that official gold reserves now exceed their holdings of U.S. Treasuries and have surpassed the euro in reserve composition — leaving gold second only to the U.S. dollar among reserve assets, and gaining on it. This behavior does not resemble momentum-chasing or fear-of-missing-out flows; it is a structural reallocation unfolding over years, and central bankers are not tourists in the gold market.
The driver, in the author's assessment, is what this research program has termed the death spiral of debt. U.S. federal debt stands near US$40 trillion, with annual servicing costs trending toward US$1.5–2 trillion depending on the path of the yield curve — a cost trajectory that is unsustainable on its face.
Nor is this an American peculiarity: global sovereign debt approaches US$325 trillion. Against that liability stack, the total valuation of gold represents less than 10% — an unhealthy ratio. In a healthier configuration, gold's aggregate value would represent 20–40% of sovereign debt; in a genuinely sound one, above 50%.
The interpretation offered here is that the fiat currency and debt system that replaced the gold standard after 1971 is broken, and that its repair runs through gold.
Indeed, central bank holdings have already returned to levels comparable to the peak of the prior gold-standard era — evidence, in the author's reading, that a modern gold standard is not a proposal but an emergent fact, still in its early stages. Fifty years of accumulating imbalance will not resolve quickly; the repair may take decades, and it can only occur at substantially higher gold prices.
On this basis the author's 2024 forecast — gold at US$20,000 per ounce within ten years — is maintained, with approximately eight years remaining and no development in the interim arguing for revision. The principal reason no revision is possible is political: no leadership constituency, particularly in the West, has shown any interest in repairing the fiat and debt system by other means; central banks will continue issuing debt and currency in the attempt to grow through the problem.
A response is owed to the sector's old-timers who counsel caution — who warn that a world of US$10,000–20,000 gold is a world of depression. The same warnings attached to US$4,000–5,000 gold, and the world at those prices has not collapsed. This paper takes the opposite position: substantially higher gold is not the symptom of catastrophe but the mechanism of healing — the sign that the broken system is being repaired. We do not merely risk arriving there; we need to arrive there.
4.2 Silver: A Structural Deficit
Silver's case combines the monetary and the industrial. In parts of the East it retains direct monetary status; across most of the world, its price is set by consumption — solar panels, electronics and other technologies, and growing defense applications. Against that demand, the market has run a persistent annual deficit of approximately 175–200 million ounces in a market producing roughly 800 million ounces from mines per year. A deficit of that proportion is not sustainable, and it contributed to silver's move to approximately US$120 earlier this year. With the metal consolidating around US$60, the author's assessment is that silver returns above US$100 before the end of this year.
4.3 Copper: The Gold of Industrial Metals
Copper is the most important strategic metal of the modern economy. It is required by artificial intelligence and cloud computing infrastructure, by lighting, by vehicles, by everything electrical — and beyond those applications, by the power-generation and grid build-out that both developed and emerging economies now require at scale. The breadth and pace of that demand growth, set against the tightness of the copper supply chain, remains broadly underappreciated. The author's assessment is that US$10–15 per pound will be required to balance this market, against a current price of approximately US$6.50. The move has, in this view, a great deal of life left in it.
4.4 The Common Constraint: A Starved Pipeline
Underlying all three metals is a shared structural condition: for the last 25–30 years, insufficient capital has flowed into the pipeline — into high-quality important discoveries, into projects in development. The industry does not hold enough projects, at any stage, to meet the demand now visible. This is the same pipeline scarcity identified in Part I as giving the feasibility-and-development trough its re-rating potential, now stated as a metals-wide supply thesis. The deficit of projects is the bridge between the macro case and the equity opportunity: when the regime transition occurs, it will occur across a sector structurally short of the very assets the transition rewards.
5. The Opportunity in the Contrast
The investment implication of Sections 3 and 4 can be stated in one sentence: the distance between Figure 1 and Figure 2 is a tremendous value proposition.
Companies with high-quality, significant discoveries remain plotted at the entry of the first sweet spot. Companies that belong well inside the second sweet spot — the development ellipse — have not been granted it. Producers, up to and including the best-run majors in the world, trade at Classic Version levels against Bull Market Version metal prices. The contrast between the two curves is not merely a framework distinction; it is, in itself, the opportunity set — across gold, silver, and copper miners, developers, and explorers with important discoveries.
6. Applications: The Top of Mind Radar Screen
6.1 Methodological Note
Part One applied the framework to the Unicorns radar screen. This paper applies it to the Top of Mind radar screen — so named because these are the companies on which the author's diligence is deep: technical reports reviewed, corporate materials and presentations studied, management interviews watched, and direct interviews conducted with every company on the screen except Southern Cross Gold and EarthLabs.
The standing definitional discipline applies and bears repetition. These are radar screens, not picks — a renaming made precisely because the former label was misconstrued as buy recommendations.
They are idea-generation lists: companies filtered through the author's decades in the business and classified by tacit knowledge, presented solely as candidates for the reader's own homework. The author is not a licensed broker, holds no knowledge of any reader's risk tolerance, and makes no buying or selling recommendations. Which categories suit a given reader — majors, mid-tiers, or the higher-risk explorer and developer classes — is a matter between the reader and their financial advisor.
Radar screen updates as of this writing: in the mid-tier category, Equinox Gold and Orla Mining have merged into the new Equinox Gold, and Orla Mining is accordingly removed as a separate entry; First Majestic has been added to the majors radar screen.
Sponsor relationships are disclosed inline and in the Disclosures section. Pirate Gold and Vizsla Silver are co-branding sponsors; Generation Mining and Amex Exploration are sponsors. Sponsored companies appear on these screens on project quality alone.
6. Applications: The Top of Mind Radar Screen
6.1 Methodological Note
Part One applied the framework to the Unicorns radar screen. This paper applies it to the Top of Mind radar screen — so named because these are the companies on which the author's diligence is deep: technical reports reviewed, corporate materials and presentations studied, management interviews watched, and direct interviews conducted with every company on the screen except Southern Cross Gold and EarthLabs.
The standing definitional discipline applies and bears repetition. These are radar screens, not picks — a renaming made precisely because the former label was misconstrued as buy recommendations.
They are idea-generation lists: companies filtered through the author's decades in the business and classified by tacit knowledge, presented solely as candidates for the reader's own homework. The author is not a licensed broker, holds no knowledge of any reader's risk tolerance, and makes no buying or selling recommendations. Which categories suit a given reader — majors, mid-tiers, or the higher-risk explorer and developer classes — is a matter between the reader and their financial advisor.
Radar screen updates as of this writing: in the mid-tier category, Equinox Gold and Orla Mining have merged into the new Equinox Gold, and Orla Mining is accordingly removed as a separate entry; First Majestic has been added to the majors radar screen.
Sponsor relationships are disclosed inline and in the Disclosures section. Pirate Gold and Vizsla Silver are co-branding sponsors; Generation Mining and Amex Exploration are sponsors. Sponsored companies appear on these screens on project quality alone.
6.2 Pirate Gold (co-branding sponsor)
Position on curve: first sweet spot, with two independent paths to potentially move up the left side. Pirate Gold is a Newfoundland explorer — but not an average one. Its Moosehead project, within the district-scale Treasure Island property, carries an established high-grade orogenic gold discovery. Roughly a year ago, the company — then Sokoman Minerals — underwent a management transition that brought in Denis Laviolette and Greg Matheson, geologists instrumental in staking and discovering much of the gold at New Found Gold's Queensway project (itself a unicorn radar screen company examined in Part I).
Since that transition, the company has made a pure grassroots discovery at Moby Dick — a porphyry-epithermal copper-gold system returning strong grades in its earliest holes, and requiring substantial further drilling as a brand-new discovery. Drilling has also begun on what appears to be an orogenic gold system directly beside Moby Dick, with assays pending; confirmation would constitute a further grassroots discovery, and the juxtaposition of a porphyry-epithermal system against an adjacent orogenic system is geologically distinctive. A point of context: very few geologists participate in even one grassroots discovery across a career. Laviolette and Matheson have now been central to two — Queensway and Moby Dick — placing them in an elite category, with a possible third pending assays.
The framework position: the market plots Pirate Gold within the first sweet spot ellipse, with two — potentially three — independent discoveries that could drive the ascent up the left side of the curve. Two kicks at the can, on one valuation.
6.3 Generation Mining (sponsor)
Position on curve: development stage; priced at the sweet spot trough. Generation Mining's copper-palladium project sits ten kilometres from the town of Marathon, Ontario, with the Trans-Canada Highway and the power lines serving Marathon crossing the property and rail nearby — infrastructure conditions about as favorable as the sector offers. The project is shovel-ready: fully permitted, with financing primarily secured. A company at that position sits, by the framework, in the development stage approaching the right-side base. The market prices it far back in the second sweet spot. The author's sponsorship bias is disclosed and the reader invited to their own judgment; the plot, in this assessment, stands.
6.4 Sterling Metals
Position on curve: earliest 10–15% of the first sweet spot; concept-to-discovery transition not yet priced. Sterling Metals holds a large land package near Batchawana Bay, Ontario — with what the author assesses as potential for a tier-one copper discovery, and low drilling costs owing to location. The valuation places the company at the earliest fraction of the first ellipse, as though the concept-to-discovery transition has not begun. The framework identifies precisely this configuration — credible tier-one potential priced at concept — as among the most asymmetric positions on the curve.
6.5 Kirkland Lake Discoveries
Position on curve: a stage-three/stage-one hybrid; priced at the ellipse entry, framework position at its midpoint or above. Kirkland Lake Discoveries presents a combination position: multiple target sets — including at KL West — each capable of driving a left-side ascent, alongside the Mirado project, which carries a historical, non-compliant resource on the order of 500,000 ounces that current drilling aims to convert and expand. In the framework's terms, the company holds a stage-three asset wrapped around several stage-one opportunities. Weighing the existing resource and the drilling completed at Mirado and KL West, the framework position is at least the midpoint of the first sweet spot with substantial left-side room remaining; the market prices the company at the ellipse entry. A recent interview with CEO Stefan Sklepowicz is available on the Lab Report powered by CEO.CA.
6.6 Borealis Mining
Position on curve: earliest production, priced far below it; the three-trajectory question ahead. Borealis Mining entered production in 2026 at the historic Borealis mine in Nevada, and has acquired a second project capable of advancing into development. The market prices the company far down the curve — partially understandable for a producer still ramping toward its ambitions. But the mid-tier vision is not outlandish given the register of those who have done their homework on it: chairman Robert Buchan, founder of Kinross, holds a significant equity position, alongside Rob McEwen and Eric Sprott. The framework assessment is that the company could enter the early stages of the production phase proper later in 2026, at which point the three-arrow question — depleting single-mine producer, range-bound operator, or compounding mid-tier — becomes live. Sentiment improvement would alter every one of those trajectories' price bands.
6.7 Blackrock Silver
Position on curve: early stage four with stage-one optionality; priced in late stage three. Blackrock Silver occupies a hybrid position: roughly the first quarter of the development stage on its principal asset, combined with drilling that preserves discovery-stage optionality. Its location beside Tonopah, Nevada, supports a comparatively fast path toward production. The market values the company back in the later stages of feasibility. The scarcity argument is decisive here: high-grade silver development projects in the global pipeline are exceptionally few, and the framework treats holders of that scarce asset class as special situations.
6.8 Nuvau Minerals
Position on curve: a restart-development position plus a conceptual gold program, at a modest combined valuation. Nuvau Minerals holds a past-producing asset — in production under Glencore as recently as a couple of years ago — requiring incremental development work to restart its copper (VMS) production. The property spans approximately 1,300 square kilometres in the Abitibi, one of the most prolific gold districts in the world, and carries a distinctive exploration angle: through 50–60 years of operation under major-company ownership focused on copper mining, the property was never explored for its gold potential. The company is therefore simultaneously mid-curve (returning a recent producer to production) and at the conceptual stage (a first systematic gold program over district-scale ground in elephant country). Success on the gold concept would layer a left-side ascent atop the restart story. The market prices the combination modestly.
6.9 Southern Cross Gold
Position on curve: high on the left side; priced well below it; a prime takeover candidate. Southern Cross Gold holds what the author terms a Fosterville 2.0: a project roughly 30 kilometres from Agnico Eagle's Fosterville mine — one of the world's great high-grade gold operations and among the most important orogenic gold systems anywhere. The project has advanced well up the left side of the curve on its merits as a world-class, multi-million-ounce-potential, high-grade system, while its valuation lags substantially below the framework position.
The strategic assessment is direct: this is the class of project that populates majors' shopping lists, and the author's expectation is that the window to follow Southern Cross Gold as an independent company may be limited — were the author running a major, this project would be acquired. The framework implication is a potential move from the current position to the premium band at the top of the left side; under Bull Market Version conditions, the takeout scenario for an asset of this quality reaches the US$3–5 billion range.
6.10 Argenta Silver
Position on curve: early stage three with an established resource; priced as a raw concept. Argenta Silver holds a project with an existing mineral resource — inferred category, on the order of 50 million ounces of very high-grade silver — placing it formally in the early feasibility stage. Management's thesis, with which the author is in full agreement on the drilling evidence, is that the system hosts considerably more silver, and additional discovery concepts on the property provide further kicks at the can. The market nonetheless values the company as a conceptual story drilling its first discovery holes, notwithstanding a defined multi-tens-of-millions-of-ounces resource. The gap between the priced stage and the actual stage is the opportunity.
6.11 EarthLabs
Position on curve: a portfolio priced as a single concept-stage explorer. EarthLabs resists single-point plotting because it is two businesses. The first is publishing: the company owns CEO.CA, The Northern Miner — the bible of the mining industry for over a century — the Canadian Mining Journal, and MINING.COM, generating advertising revenue nearly sufficient to carry the company's overhead as a public company. The second, and larger, is a portfolio of high-quality explorers and developers, carried at approximately CAD$80 million in the most recent quarterly report, with the company trading at roughly 50% of that portfolio's net asset value.
The correct framework treatment is as a basket: a diversified position across the first sweet spot and left side of the curve, selected by a team with demonstrated ability in exactly that discipline — and a natural vehicle for generalist investors unwilling to invest in individual explorers. The market instead prices the basket as though it were a single concept-stage explorer, with the self-funding publishing business attached at little to no implied value.
7. Implementation
The framework's operational cadence is now established. On the Lab Report powered by CEO.CA — Monday through Thursday on CEO.CA's official YouTube channel — each program comprises a market overview and deep dives into companies with standout news, with every deep dive concluding in a Lassonde Curve classification. Company interviews, including the Kirkland Lake Discoveries conversation referenced above, are now conducted on that platform.
On Rocks And Stocks News, thematic reports in this series continue, working through the radar screens in turn: Part One addressed the Unicorns; this paper addresses Top of Mind; subsequent editions will address the miners (majors, mid-tiers, and junior miners) and the developers and explorers.
Part One of this series is available in written form on CEO.CA, with the PDF edition available by request to rocksandstocksnews@gmail.com. Current radar screens, with updates, are maintained on the Rocks And Stocks News Substack.
8. Conclusion
A geologist colleague recently put the matter in a sentence that this series adopts as its epigraph in reverse — offered here at the close instead: you cannot kill the Lassonde Curve, and you cannot beat it. The curve has worked for as long as it has existed, and market participants who disregard it do so at their peril.
What this series adds to that durable insight is regime awareness. The curve is not one map but two, and knowing which regime governs is as important as knowing where a company plots. Today's configuration — Bull Market Version metal prices governed by Classic Version equity metrics, across a sector whose project pipeline has been starved for a generation — is, in the author's assessment, temporary.
The structural forces documented in Section 4 point in one direction. When the transition arrives, the companies examined here, and the radar screens from which they are drawn, are where this research program will be watching it happen — with the correct map already in hand.
Disclosures and Disclaimer
The author does not make buying or selling recommendations and is not a licensed broker or investment advisor. All companies discussed are drawn from the author's radar screens, which are idea-generation lists compiled from the author's 32 years of experience in the mining sector and 20-plus years as a market commentator, and are presented solely as candidates for readers' independent research. Pirate Gold and Vizsla Silver are co-branding sponsors of the author's platforms; Generation Mining and Amex Exploration are sponsors. Sponsored companies discussed herein — Pirate Gold and Generation Mining in this paper — are included on the basis of project quality, and the author's bias with respect to sponsored companies is disclosed where they appear. All market views, price forecasts, and company assessments expressed herein are the author's opinions. Nothing in this document constitutes investment advice. Readers should conduct their own due diligence, assess their own risk tolerance, and consult a qualified financial advisor before making any investment decision.
© Lab Report powered by CEO.CA. All rights reserved.