


Northisle Copper and Gold Inc. (TSX-V: NCX) (“Northisle” or the “Company”) is pleased to announce an initial mineral resource estimate (the “Resource Estimate”) for the Northwest Expo deposit at its 100% owned North Island Project, located on Vancouver Island in BC, Canada.
This press release features multimedia. View the full release here: https://www.businesswire.com/news/home/20240313014096/en/
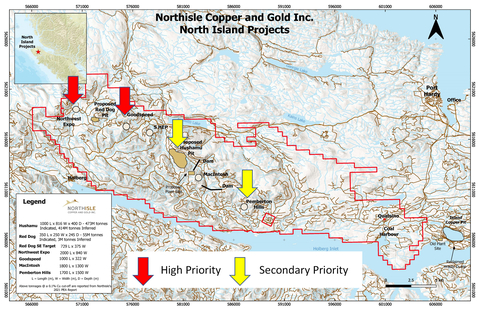
Figure 1: North Island Project Showing 2024 Areas of Focus (Graphic: Business Wire)
Sam Lee, President & CEO of Northisle stated “Today’s new resource estimate at Northwest Expo has exceeded our expectations of defining a 40 to 50 million tonne resource within the gold enriched Zone 1. Including the impact of the 88% gold and 76% copper recoveries, the average NSR value per tonne is nearly triple the NSR value in the North Island Project PEA and approximately $80/tonne at spot prices. With a relatively low strip ratio, this sets a strong basis for the rapid advancement of a potential high margin, near surface deposit that could be sequenced at the beginning of our large, long life North Island Copper and Gold project. We will be aggressively advancing development and exploration under our fully funded 2024 program.”
The initial Northwest Expo Indicated Resource contains 40.3 million tonnes grading 0.80g/t Au Eq. for 1.0 million ounces Au Eq. plus an additional 30.6 million tonnes grading 0.68g/t Au Eq. for 0.7 million ounces Au Eq. in Inferred Resources, at a 0.18g/t Au Eq. cut-off grade. Based on exploration costs by Northisle at Northwest Expo to date, this represents a discovery cost of well below $10/oz Au Eq.
As shown in Table 1 below, following the addition of the Northwest Expo deposit, the total resource for the North Island Project now comprises an Indicated Resource of approximately 2.4 bn lbs Cu and 4.9Moz Au plus Inferred Resource of approximately 1.4 bn lbs Cu and 3.0Moz Au. The Northwest Expo deposit boasts an attractive NSR value of $55/t for the Indicated resource as a whole and $67/t for the higher grade zone which represents 2-3 times the NSR value of Hushamu and Red Dog, due to higher gold grade and higher recovery rates. At spot prices NSR values are approximately $80/tonne at a 0.5 g/t Au Eq. cut off.
The near surface sizeable initial resource delineated within the gold-enriched Zone 1 at Northwest Expo provides the opportunity to optimize the development plan of the North Island Project. Trade-off studies have been launched to study the possibility for a lower capex staged approach, prioritizing the higher-grade Northwest Expo deposit with potential to concurrently focus on the higher-grade areas of the Red Dog and Hushamu deposits. These trade-off studies are expected to be completed in Q2-2024 and will form the basis for advanced economic and technical studies.
Table 1: Combined North Island Project Resource Estimate
|
|
Grade |
Contained Metal |
|||||||||||||||
|
Tonnes |
Cu |
Au |
Mo |
Re |
Cu |
Au |
Mo |
Re |
|||||||||
|
000s |
% |
g/t |
% |
g/t |
mm lbs |
000s oz |
mm lbs |
000s kg |
|||||||||
Indicated |
||||||||||||||||||
Northwest Expo |
40,310 |
0.11 |
0.67 |
- |
- |
100.2 |
871.0 |
- |
- |
|||||||||
Red Dog |
54,490 |
0.22 |
0.31 |
0.004 |
- |
264.3 |
543.3 |
4.8 |
- |
|||||||||
Hushamu |
472,854 |
0.20 |
0.23 |
0.008 |
0.35 |
2,084.9 |
3,496.7 |
83.4 |
165.5 |
|||||||||
Total Indicated |
567,654 |
0.20 |
0.27 |
0.007 |
0.35 |
2,449.4 |
4,911.0 |
88.2 |
165.5 |
|||||||||
Inferred |
||||||||||||||||||
Northwest Expo |
30,612 |
0.09 |
0.57 |
- |
- |
62.8 |
558.0 |
- |
- |
|||||||||
Red Dog |
2,979 |
0.17 |
0.25 |
0.002 |
- |
11.2 |
23.9 |
0.1 |
- |
|||||||||
Hushamu |
414,293 |
0.15 |
0.18 |
0.006 |
0.29 |
1,370.0 |
2,397.6 |
54.8 |
120.1 |
|||||||||
Total Inferred |
447,884 |
0.15 |
0.21 |
0.006 |
0.29 |
1,444.0 |
2,979.5 |
54.9 |
120.1 |
|||||||||
Notes to the Combined Resource Table:
- Classifications are compliant with CIM Resource Definition Standards, 2014
- The effective date of the Red Dog Resource Estimate is March 14, 2017. The effective date of the Hushamu Resource Estimate is November 29, 2020. See the Company’s Preliminary Economic Assessment issued May 22, 2022 with an effective date of February 4, 2021 (the “2021 PEA”).
- Resources at Hushamu and Red Dog are based on a 0.1% Cu cut-off grade. Northwest Expo is based on a 0.18gpt AuEq cut-off grade.
- The Hushamu and Red Dog Resources are based on the mining and processing cost assumptions detailed in Sections 21 and 22 of the 2021 PEA including metal prices of US$3.25/lb Cu, US$1,650/oz Au, US$10/lb Mo with recoveries of 86%, 47% and 74%, respectively.
- Amounts may not total due to rounding.
- Mineral Resources that are not Mineral Reserves do not have demonstrated economic viability. There are no Mineral Reserves.
- The estimate of Mineral Resources may be materially affected by geology, environment, permitting, legal, title, taxation, sociopolitical, marketing or other relevant factors.
- Additional notes including metal price and modelling assumptions relating to the Northwest Expo 2024 Resource Estimate may be found in Table 2 below.
Figure 1 shows the location of the deposits within the North Island Project in the context of regional infrastructure.
Details of Northwest Expo Resource Estimate
The Northwest Expo Resource Estimate includes a total of 32 diamond drill holes totalling 14,333 meters drilled by Northisle and previous operators from 2005 through the end of 2023, of which 20 holes totalling 9,367 meters were completed by Northisle between 2021 and 2023.
Table 2 below summarizes the Northwest Expo Resource Estimate and shows the robustness of the deposit based on the sensitivity of the Resource Estimate to cut-off grade. The base case cut-off grade of 0.18g/t Au Eq. covers the estimated processing and G&A costs.
Table 2: Northwest Expo Mineral Resource Estimate
AuEq Cutoff |
Class |
In Situ Tonnage and Grade |
AuEq Metal |
Au Metal |
Cu Metal |
S/R |
||||
Tonnage |
AuEq |
Au |
Cu |
NSR |
||||||
(gpt) |
(ktonnes) |
(gpt) |
(gpt) |
(%) |
(C$/t) |
(kOz) |
(kOz) |
(kOz) |
Waste / Mineral |
|
0.18 |
Indicated Inferred |
40,310 |
0.799 |
0.672 |
0.113 |
55.44 |
1,035 |
871 |
100,154 |
2.52 |
30,612 |
0.676 |
0.567 |
0.093 |
46.75 |
665 |
558 |
62,764 |
|||
0.3 |
Indicated Inferred |
37,450 |
0.841 |
0.708 |
0.119 |
58.40 |
1,013 |
852 |
98,085 |
2.99 |
25,113 |
0.771 |
0.649 |
0.105 |
53.38 |
622 |
524 |
58,077 |
|||
0.4 |
Indicated Inferred |
33,960 |
0.892 |
0.750 |
0.126 |
61.90 |
973 |
819 |
94,110 |
3.50 |
21,534 |
0.841 |
0.711 |
0.113 |
58.27 |
582 |
492 |
53,741 |
|||
0.5 |
Indicated Inferred |
29,595 |
0.957 |
0.806 |
0.134 |
66.43 |
910 |
767 |
87,560 |
4.25 |
18,000 |
0.918 |
0.778 |
0.122 |
63.64 |
531 |
450 |
48,572 |
|||
0.6 |
Indicated Inferred |
25,318 |
1.026 |
0.866 |
0.143 |
71.25 |
835 |
705 |
79,874 |
5.26 |
14,576 |
1.005 |
0.855 |
0.132 |
69.73 |
471 |
401 |
42,514 |
|||
0.7 |
Indicated Inferred |
21,283 |
1.097 |
0.927 |
0.152 |
76.22 |
750 |
635 |
71,414 |
6.51 |
11,990 |
1.082 |
0.922 |
0.142 |
75.13 |
417 |
355 |
37,588 |
|||
Notes to the 2024 Resource Table:
- Resources are reported using the 2014 CIM Definition Standards and were estimated using the 2019 CIM Best Practices Guidelines, as required by NI43-101. The estimate has an effective date of March 1, 2024.
-
The base case Mineral Resource has been confined by a "reasonable prospects of eventual economic extraction" shape using the following assumptions:
- Metal prices of US$1800/oz Gold, US$3.50/lb Copper, exchange rate of 0.75 USD:CAD
- Metallurgical recovery of 91% Gold, 73% Copper in the Chlorite-Magnetite-Silica (CMG) and 89% gold, 88% Cu in Silica-clay-Pyrite (SCP) and all other material. Weighted average recoveries of 88% Au and 76% Cu.
- Payable metal of 99.9% Gold and 99% Cu
- Offsite costs (transport, smelter treatment and refining) of C$10/oz gold, and C$0.07/lb copper
- Processing Cost of C$10.00 and General, and Administrative (G&A) costs of C$2.50/t milled
- Mining cost of C$3.00/t mined and 48 degree pit slopes
- The 100% price case pit shell is used for the confining shape - The resulting NSR = (Au*US$76.765/g*Recovery + 22.0462*(Cu*US$4.617/lb*Recovery))/0.75
- The resulting AuEq in CMG is: AuEq = Au + 1.064Cu% and for SCP is: AuEq = Au + 1.311Cu%
- The specific gravity of the resource is variable by lithology between 2.61 and 2.77.
- Numbers may not add due to rounding.
- Mineral Resources that are not Mineral Reserves do not have demonstrated economic viability. There are no Mineral Reserves.
- The estimate of Mineral Resources may be materially affected by geology, environment, permitting, legal, title, taxation, sociopolitical, marketing or other relevant factors.
The Resource Estimate was prepared by Sue Bird, P.Eng. of Moose Mountain Technical Services (“MMTS”) who is independent of Northisle. The Company has determined that a Technical Report update is not required for the North Island Project as a result of the Northwest Expo Mineral Resource. Should the company complete an updated Technical Report on the North Island Project in the future, the Mineral Resource will be included.
Figure 2 below shows the resource pit shell and modelled block grades above 0.50g/t Au Eq. The estimation methodology is detailed further below, in “Details of Resource Estimation Methodology”.
Key Catalysts
The Company has a number of important catalysts over the next several months which it believes will continue to establish the North Island Project as one of the best new mining camps in the world. These include the following:
- COMPLETED - Final 2023 Northwest Expo Drill Results
- COMPLETED - Inaugural Northwest Expo Zone 1 resource estimate including Phase 3 Drilling
- COMPLETED - Metallurgical testing results from Northwest Expo Zone 1
- Q2 2024 - Preliminary Project Trade-offs
- Q2 2024 - Geophysics results from Northwest Expo and West Goodspeed
- Q2 2024 - Final 2023 Pemberton Hills Drill Results
- Q2 2024 - Target commencement of 2024 drilling program
- Q3 2024 - Target commencement of advanced economic and technical studies
- H2 2024 - Initial Results from 2024 drill programs
- Ongoing - Continued engagement with indigenous rightsholders and local stakeholders
Upcoming Investor Events
During 2024, the Company will continue to be active in investor outreach. Northisle will be attending several external investor events including the following events during Q2/Q3 2024:
- March 20, 2024 at 7PM ET / 4PM PT: Townhall Webinar with FTMIG
- April 8 – 10, 2024: Gold Forum Europe, Zurich, CH
- September 10 – 13, 2024: Precious Metals Summit, Beaver Creek, CO
- September 15 – 18, 2024: Gold Forum Americas, Colorado Springs, CO
Additional Technical Details
Details of Resource Estimation Methodology
A confining shape for the interpolations has been made using the alteration type modeling shapes provided by North Isle, the logged alteration / lithologies and the metal grades.
Capping of assays has been implemented at 10gpt for Au and 1% for Cu. Outlier restriction of composites during interpolation was also implemented with values above 2gpt Au and above 0.40% Cu essentially capped beyond a 10m distance from the composite.
Compositing has been done by three meter intervals honoring the domain boundary for each element. Three meters was selected because it is the length of the longest assays. Values less than 1.5m have been added to the composite above to avoid small composite lengths.
Ordinary Kriging interpolations have been used for both Au and Cu interpolations. Search distances and orientations for each metal are based on the variography.
Resource classification is based on the distance between drillholes with criteria based on the variography using the following process.
- All interpolated blocks are initially classified as Inferred.
- Blocks are upgraded to Indicated if the average distance to the two nearest drillholes is less than 65 meters.
- Blocks were then examined and those near surface were downgraded to Inferred due to lack of near-surface drilling and extrapolation in this area. A small number of blocks of isolated Indicated were downgraded to Inferred and of isolated Inferred upgraded to Indicated to ensure continuity of classification.
Summary of Phase 3 Final Drill Results
Table 3 below summarizes key highlights released today from the final portion of the Northwest Expo 2023 drill program, including significant intercepts from NW23-23, NW23-24, NW23-25 and NW23-26, which continue to demonstrate continuity of mineralization particularly to the northwest of the Northwest Expo deposit footprint.
Table 3: Newly Released Northwest Expo Significant 2023 Intercepts
Hole ID |
From (m) |
To (m) |
Interval (m) |
True Width (m) |
Au Grade (g/t) |
Cu Grade (%) |
Mo Grade (%) |
Re Grade (g/t) |
||||||||
NW23-23 |
385 |
453 |
68 |
56 |
0.242 |
0.06 |
0.018 |
0.567 |
||||||||
NW23-24 |
192 |
402 |
210 |
126 |
0.553 |
0.09 |
0.014 |
0.443 |
||||||||
Including |
258 |
402 |
144 |
86.4 |
0.715 |
0.12 |
0.007 |
0.293 |
||||||||
NW23-25 |
266 |
324.2 |
58.2 |
58.2 |
0.790 |
0.14 |
0.001 |
0.002 |
||||||||
including |
293 |
324.2 |
31.2 |
31.2 |
1.100 |
0.21 |
- |
- |
||||||||
NW23-26 |
348 |
381 |
33 |
33 |
0.293 |
0.04 |
- |
- |
Copper and gold equivalent calculations based on the following metal prices which were used in the Company’s 2021 PEA on the North Island Project:
Cu = US$3.25/lb, Au = US$1,650/oz, Mo = US$10/lb, Re = $1,256/kg. Calculations assume 100% recovery; totals may not add due to rounding.
Note on equivalent calculation:
Copper equivalent is determined by calculating total contained metal value/ tonne, dividing by the copper price, and then dividing the resultant number of pounds of copper by 2204.6. Gold equivalent is determined by calculating total contained metal value/tonne, dividing by the gold price, and then multiplying the resultant number of troy ounces of gold by 31.103. Analyzed metal equivalent calculations are reported for illustrative purposes only. The metal chosen for reporting on an equivalent basis is the one that contributes the most dollar value after accounting for assumed recoveries, which is expected to be gold for Northwest Expo and copper for the overall North Island project.
NW23-22 was drilled approximately 125 meters to the northeast of NW23-19. Together, these holes provide important vectoring information indicating movement from the advanced argillic alteration characteristic of the lithocap domain of this porphyry system into the quartz-sericite-pyrite alteration characteristic of the periphery of the causative porphyry centre, but do not contain economically significant copper or gold grades.
Phase 3 of the 2023 Northwest Expo drilling program is comprised of eight drill holes as shown highlighted in yellow in Table 2 and is also shown in Figure 3. Three of these drill holes were released previously, and the final five holes of the 2023 program are discussed in detail below.
The coordinates of all drill holes were reported in Table 2 of the Northisle January 17, 2024 press release detailing the first portion of Phase 3 drill results: https://bit.ly/nwexpophase3part1
The image shown in Figure 4 displays the topography and faulting as viewed to the northwest. Figure 3 is a detailed plan of all drill holes in Zone 1.
NW23-23 to NW23-26 were drilled to aid in the resource modeling described above. The drilling extended mineralization northwest to NW23-26, which exhibited anomalous gold values but which are marginal given the resource modelling assumptions detailed above. There is a significant gap of 200 meters with limited drilling between this intercept and NW23-25 which contained two significant intercepts as detailed above. Additional drilling is planned in 2024 to in-fill this area of the Resource Estimate.
Northisle has re-logged the core from the previous programs at Northwest Expo. Check assays have not been carried out on this core, however the mineralized lithologies observed and relogged, as well as related assays results, are consistent with adjacent holes drilled, logged and assayed by Northisle. Results of the previous programs at Northwest Expo were first disclosed in the following reports:
- Baker, D. (2005). Geological, Geochemical, Geophysical and Diamond Drilling Report on the Hushamu Property, Volumes A, B, C
- Lehtinen, J., and Awmack, H. (2007). Diamond Drilling Report on the Hushamu Property
- Baldys, C., Burgert, A. and Houle, J. (2008). Technical Report on the Island Copper Property
Logging, Sampling and Assaying Procedures and QA/QC
The diamond drill core logging and sampling program was carried out under a rigorous quality assurance / quality control program using industry best practices. Drill intersections in this release are typically HQ to 100 m and NQ thereafter to the end of holes. After drilling, core was logged for geology, structure, and geotechnical characteristics utilizing Geospark© core logging software, then marked for sampling and photographed on site. The cores for analyses were marked for sampling based on geological intervals with individual samples 3 m or less in length. Drill core was cut lengthwise in half with a core saw. Half-core was sent for assays reported in this news release. Prior to cutting core for assay bulk density was also determined on site by taking 15 to 20 cm lengths of whole core of each lithology at 10 m intervals. The ends of these were then cut at right angle to the core axis, retaining all pieces to be returned to the core box for later sample cutting and analysis. The diameter of each core sampled for bulk density was measured at each end with digital calipers to 3 decimal places and recorded. The length of the core was measured on four sides at 90 degrees to each other, to 2 decimal places and recorded. The software averaged the lengths and diameters. The mass of the dry core was measured twice on an Ohaus© balance to 2 decimal places. If no discrepancy occurred the measurement was recorded. If there was a discrepancy the measuring was repeated until no discrepancy between 2 measurements occurred. The density was calculated using the formula Bulk Density = π times r² times h (where r is radius of core and h is length of core). Certified standard masses are used to calibrate the scale balance used for bulk density determinations. The balance in the core logging area was levelled on a large concrete block to avoid vibration, was leveled, and surrounded by a wooden partition to avoid wind affecting the balance. The measurements were recorded in Geospark© logging software and Bulk Density calculated to 2 decimal places.
A total of 5% assay standards or blanks and 5% core duplicates are included in the sample stream as a quality control measure and are reviewed after analyses are received. Standards were obtained from WCM Minerals, Vancouver, CDN Minerals, Langley and OREAS, Canada. Blanks were obtained from unmineralized course bagged limestone landscaping rock. Standards and blanks in 2023 drill results to date have been approved as acceptable. Duplicate data add to the long-term estimates of precision for assay data on the project and precision for drill results reported is deemed to be within acceptable levels. Samples were sent to the MSALABS in Langley, BC where the samples were dried, then crushed, split and a 250 g split was pulverized to 85% passing -200 mesh (-75µm) size pulps. Clean crush material was passed through the crusher and clean silica was pulverized between each sample. The pulps were analyzed for gold by fire assay fusion of 50 g of the 250 g split. Total gold content was determined by digesting the silver doré bead from the fusion and then analysing by AA (MSA Code FAS-121). All samples were also analyzed for multiple elements by taking a 0.25 g of the 250g split which was heated in HNO3, HClO4 and HF to fuming and taken to dryness. The residue was dissolved in HCl and then analyzed utilizing ICP-MS (MSA Code IMS-230). Any sulphur analysis from this latter analysis with a value greater than 10% was reanalyzed utilizing a Leco sulfur analyzer. Iron and Tungsten accelerators are added to the sample and a stream of oxygen is passed over the sample in the induction furnace. As the sample is heated, sulfur dioxide released from the sample is measured by an IR detection system and the Total Sulphur content is determined. (MSA Code SPM-210). MSALABS (Langley) is an independent, international ISO/IEC 17025:2005 accredited laboratory.
Pulps and rejects of holes with significant assay intervals are stored at Western Mineral Storage. The remaining split core is indexed and stored at Northisle logging and office facility in Port Hardy, BC.
Drill Results in this news release are length weighted averages.
Qualified Persons and Data Verification
Robin Tolbert, P.Geo., Vice President Exploration of Northisle, and a Qualified Person as defined by National Instrument 43-101, has reviewed and approved the scientific and technical disclosure contained in this news release, including the sampling, analytical and test data, the summary of the combined Resource Estimates for the Northwest Expo, Red Dog and Hushamu, and the Logging, Sampling and Assaying Procedures and QA/QC.
Sue Bird, P. Eng, V.P. of MMTS, and a Qualified Person as defined by National Instrument 43-101, has reviewed and approved the scientific and technical disclosure contained in this news release relating to the Northwest Expo Resource Estimate. Ms. Bird has verified the data incorporated in the Resource Estimate by certificate checks, standards, blank and duplicate plots. There is no historic drilling on the deposit. Ms. Bird experienced no limitations with respect to data verification activities related to the Northwest Expo deposit or the North Island Project.
About Northisle
Northisle Copper and Gold Inc. is a Vancouver-based company whose mission is to become Canada’s leading sustainable mineral resource company for the future. Northisle, through its 100% owned subsidiary North Island Mining Corp., owns the North Island Project, which is one of the most promising copper and gold porphyry projects in Canada. The North Island Project is located near Port Hardy, British Columbia on a more than 34,000-hectare block of mineral titles 100% owned by Northisle stretching 50 kilometers northwest from the now closed Island Copper Mine operated by BHP Billiton. Northisle completed an updated preliminary economic assessment for the North Island Project in 2021 and is now focused on advancement of the project through a prefeasibility study while continuing exploration within this highly prospective land package.
For more information on Northisle please visit the Company’s website at www.northisle.ca.
Cautionary Statements regarding Forward-Looking Information
Certain information in this news release constitutes forward-looking statements under applicable securities law. Any statements that are contained in this news release that are not statements of historical fact may be deemed to be forward-looking statements. Forward-looking statements are often identified by terms such as “may”, “should”, “anticipate”, “expect”, “intend” and similar expressions. Forward-looking statements in this news release include, but are not limited to, statements relating to the Resource Estimate, plans and expectations regarding the 2024 exploration program, plans and expectations regarding future project development, timing of key catalysts; planned activities, including further drilling, at the North Island Project; the Company’s anticipated exploration activities; and the Company’s plans for advancement of the North Island Project. Forward-looking statements necessarily involve known and unknown risks, including, without limitation, Northisle’s ability to implement its business strategies; risks associated with mineral exploration and production; risks associated with general economic conditions; adverse industry events; stakeholder engagement; marketing and transportation costs; loss of markets; volatility of commodity prices; inability to access sufficient capital from internal and external sources, and/or inability to access sufficient capital on favourable terms; industry and government regulation; changes in legislation, income tax and regulatory matters; competition; currency and interest rate fluctuations; and other risks. Readers are cautioned that the foregoing list is not exhaustive.
Readers are further cautioned not to place undue reliance on forward-looking statements as there can be no assurance that the plans, intentions, or expectations upon which they are placed will occur. Such information, although considered reasonable by management at the time of preparation, may prove to be incorrect and actual results may differ materially from those anticipated. Forward-looking statements contained in this news release are expressly qualified by this cautionary statement.
The forward-looking statements contained in this news release represent the expectations of management of Northisle as of the date of this news release, and, accordingly, are subject to change after such date. Northisle does not undertake any obligation to update or revise any forward-looking statements, whether as a result of new information, future events or otherwise, except as expressly required by applicable securities law.
Neither the TSX Venture Exchange nor its Regulation Services Provider (as that term is defined in the policies of the TSX Venture Exchange) accepts responsibility for the adequacy or accuracy of this news release.
View source version on businesswire.com: https://www.businesswire.com/news/home/20240313014096/en/
