Now that I have your attention i'd like to emphasize the important of being clear on which time frame you are talking about, and most importantly, which time frame you are investing/trading in. Are you a long term investor OR are you a trader? Are you looking for a quick 10% flip or are you prepared to withstand market volatility which will inevitably include 20% or even 50% declines in order to eventually achieve 500% or even 1000% gains? In order to generate big gains requires taking significant risk, there is no other way.
These are important questions to ask oneself, and it is even more important to answer them honestly, and then not confuse time frames or trading/investment objectives due to noise, either from "news" or intraday price swings. Those of us who have been at this junior mining and precious metals game for more than a few years can recount many stories of large losses and years spent dawdling with portfolio positions that only seemed capable of oscillating between $.05 and $.10 regardless of what happened. News releases were used as excuses to sell into any liquidity hardly without exception - God forbid a company tried to raise money to fund exploration, The stock would be down 20% in a blink of an eye.
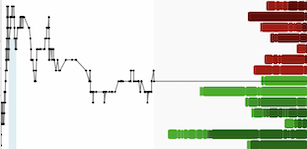
Many of us have probably experienced a healthy dose of market volatility this year as many precious metals/mining focused portfolios dropped ~50% from January/February to the March low, only to rebound to new all-time highs today.
GDXJ (Year-To-Date)

In the last week there has been a lot of talk about a top in mining stocks and precious metals. After all, the Daily Sentiment Index for gold and silver have both moved above 90 in recent days - a level which can often indicate euphoria and that a short-term peak is close at hand.
While it's likely that we are due for a pullback/correction in the precious metals space at some point over the coming days/weeks, if we are too fearful of a short term drawdown we may miss out on much larger gains over the long term.
Let's flip through some charts so I can show you what i'm seeing. Let's start with the Gold Bugs Index (HUI) monthly chart:
Gold Bugs Index (Monthly)

After a more than seven year bottoming process the HUI has finally thrust back above major resistance (2016 high) to levels not seen since early April 2013, right before gold plunged more than $200 in a single 24-hour period. Not only is the breakout on the monthly chart from a 7+ year bottom highly significant in itself, there are other factors worth noting in the HUI Monthly chart:
- Monthly-RSI(14) has moved back above the 70 level for the first time in more than a decade.
- If we look at past bull markets we will notice that the first push above 70 on monthly Relative Strength is a signal the bull market is JUST BEGINNING, not ending. There are often many subsequent thrusts into 'overbought' territory as price continues trending higher.
- While there are things called 'failed breakouts', they tend to fail quickly - the final trading week of July will be important as the monthly candle for July is not yet complete.
- The slope of the gold miners' ascent on the weekly and monthly charts is nothing close to the parabolic curve one would expect at a major long term top.
- Previous bull market cycles have seen gold miners increase 10x-20x across the board as a sector, the current cycle (beginning at the August/September 2018 lows) has not even reached 3x.
Turning to the gold weekly chart we can see that Relative Strength is no where near extreme overheated levels which coincided with major tradable tops in 2006, 2008, and 2011:
Gold (Weekly)

Bull markets are built on so called "bearish RSI divergences" (price moving higher even as RSI does not reach new highs on a given time frame) and I actually prefer to see the weekly-RSI(14) for gold a shade under the 70 level as price approaches all-time high levels. While anything can happen in markets in a given day or week, the gold chart does not look like one that it is about to roll-over and die.
In fact, quite the opposite.
The factors contributing to the gold price rally in 2020 (negative and falling real rates, rising geopolitical tensions, and a declining US dollar, etc.) show no signs of abating anytime soon. The prospect of a contentious US election season and accelerating political profligacy will only serve to keep a firm bid under gold and silver over the coming months.
Turning to silver, the monthly chart exhibits a classic breakout pattern from a 7+ year bottoming process:
Silver (Monthly)

Does this look like a chart that is topping to you?
The potential energy built up during a 7+ year bottoming process is just beginning to be unleashed - if you look to the left of the chart you might notice the 2010-2011 silver rally, this breakout is just beginning and if history is any guide there are at least few more months left.
In fact, if we have a look at previous silver bull markets we can quickly deduce that the current one might be in its earliest stages:

It looks like silver is just getting warmed up. The 2008-2011 rally is the one that most reminds me of the situation in which we find ourselves today and that means we might have just completed the first inning of this bull market ascent.
You can be sure there will be multiple 10%-20% corrections over the next few years, and each time there will be no shortage of market observers shouting that this is it. The bull market is over. They will eventually be right, just like a broken clock is right twice a day.
While a 'massive top' (one that is not surpassed within a few months) in precious metals will eventually be put in place, I don't see sufficient evidence to expect that one will form anytime soon.
DISCLAIMER: The work included in this article is based on current events, technical charts, company news releases, and the author’s opinions. It may contain errors, and you shouldn’t make any investment decision based solely on what you read here. This publication contains forward-looking statements, including but not limited to comments regarding predictions and projections. Forward-looking statements address future events and conditions and therefore involve inherent risks and uncertainties. Actual results may differ materially from those currently anticipated in such statements. This publication is provided for informational and entertainment purposes only and is not a recommendation to buy or sell any security. Always thoroughly do your own due diligence and talk to a licensed investment adviser prior to making any investment decisions. Junior resource companies can easily lose 100% of their value so read company profiles on www.SEDAR.com for important risk disclosures. It’s your money and your responsibility.


