I think that by now my readers know that I don't take these economic reports too seriously. After all, they are all subject to revision and often filled with flawed data. This morning, market participants received the US non-farm payrolls report for February and the initial reaction was one of applause. Some commentators even dubbed it a 'perfect report' that continues to demonstrate disinflationary trends.
That's cool. And this take is correct because the trend in average hourly earnings is pretty clear since the end of 2021:

We're still getting increases, but at a slowing rate of increase.
I should also note that for the first time in years I am seeing evidence of FALLING prices in various pockets of the economy; Redfin reports that median rents fell .3% from a month earlier, and Florida utility FPL let its customers know that they can expect a 3%-4% decline in their energy bills beginning in May (due to the decline in natural gas prices).
However, the best data that we get every single weekday are market prices, and those prices saw some big movements yesterday. The financial sector as represented by the XLF got hit to the tune of more than 4% (regional bank index -6.5%), and individual stocks like SIVB saw a complete implosion in share price (-80%). There are growing signs of a solvency crisis at certain banks with VC/crypto/tech exposure. California and more specifically Silicon Valley is ground zero for these sectors, thus it's not a big surprise that both Silvergate Capital (NYSE:SI) and Silicon Valley Bank (Nasdaq:SIVB) are the ones getting taken to the woodshed in recent weeks.
The combination of a nascent credit crisis stemming from Silicon Valley and continued signs of rapidly slowing inflation across the economy gives the Fed cover to continue with another 25bps rate hike on March 22nd. There will then be a six week break before the next FOMC meeting in May, this will give the Fed plenty of data to chew on in the form of a slowing economy and a steadily rebalancing labor force.
We could be in the first inning of the sweet spot to own gold as banking solvency and the strengthening disinflationary trend bring the Fed closer to a pause. Gold traders will want to focus intently on signs of divergence between equities, gold, and treasury yields (like we witnessed yesterday).
From a technical standpoint, $1825 is important support in gold, followed by $1780-$1785 (which roughly lines up with the 200-day moving average). Whereas, a weekly close above $1861 could signal the correction that began the end of January has concluded:
Gold (Daily)

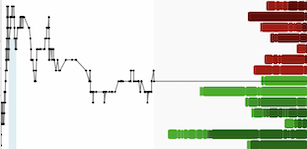
The sentiment backdrop on gold & silver walking in Thursday morning was sufficiently negative that conditions are supportive for a rally back above $21 in silver and to $1880-$1900 in gold over the next week.
If my own reticence to add to GDXJ longs at the close yesterday is any indication "when the time comes to buy you won't want to":

DISCLAIMER: The work included in this article is based on current events, technical charts, company news releases, and the author’s opinions. It may contain errors, and you shouldn’t make any investment decision based solely on what you read here. This publication contains forward-looking statements, including but not limited to comments regarding predictions and projections. Forward-looking statements address future events and conditions and therefore involve inherent risks and uncertainties. Actual results may differ materially from those currently anticipated in such statements. This publication is provided for informational and entertainment purposes only and is not a recommendation to buy or sell any security. Always thoroughly do your own due diligence and talk to a licensed investment adviser prior to making any investment decisions. Junior resource companies can easily lose 100% of their value so read company profiles on www.SEDAR.com for important risk disclosures. It’s your money and your responsibility.


