Highlights:
- NPV of US$783m (pre-tax) and IRR of 33% at 5% discount rate and US$1700/oz gold price.
- NPV of US$503m (post-tax) and IRR of 26% at 5% discount rate and US$1700/oz gold price.
- Overall capital cost of US$375 million (incl. US$41m contingency, US$22m capitalised pre-strip, US$20m solar plant and US$8m grid power).
- Capital estimate includes latest consumer prices and reflects the recent dramatic price escalations especially in steel, reagents, diesel prices and transport costs.
- Payback period of 2.3 years.
- 13-year Life-of-Mine (“LOM”) and 5.0 million tonnes per annum (“Mtpa”) processing capacity.
- Average annual gold production (first 4 years) of 200koz at US$890/oz all-in sustaining cost.
- Average annual gold production (first 10 years) of 169koz at US$930/oz all-in sustaining cost; LOM average production of 152koz at US$939/oz.
- LOM gold recovery of 93.2% (first 6 years) and 92.0% (LOM) utilising a conventional 3-stage crushing, ball milling, gravity separation, pre-oxidation and CIL circuit plus a double-lined dry-stack tailings facility.
- Total Proven and Probable Reserves of 2.150 Moz from 64.3 Mt at 1.04 g/t (at 0.3g/t cut-off).
Osino will host a webinar to discuss the PFS results, today, September 6, 2022 at 11am ET (8am PT). Register here to participate: https://attendee.gotowebinar.com/register/2347595189721541904
VANCOUVER, British Columbia, Sept. 06, 2022 (GLOBE NEWSWIRE) -- Osino Resources Corp. (TSXV:OSI) (FSE:RSR1) (OTCQX:OSIIF) ("Osino” or “the Company”) is pleased to announce the results of the pre-feasibility study (“PFS”) for Osino’s Twin Hills Gold Project (“Twin Hills“ or the “Project”), which is located in central Namibia and is rapidly being advanced through accelerated exploration drilling and fast-tracked development studies.
The PFS was prepared by Lycopodium Minerals Canada (“Lycopodium”) in accordance with National Instrument 43-101—Standards of Disclosure for Mineral Projects ("NI 43-101") and contemplates a low-risk, technically simple open-pit mine utilizing contract mining and feeding a conventional carbon-in-leach (“CIL”) metallurgical plant processing 5 million tonnes of mineralized material per annum.
Heye Daun, Osino’s co-founder, President & CEO commented: “We are very pleased with the results of this PFS which demonstrates that Twin Hills is what we always said it would be, namely a long-life, low-cost and economically robust open pit gold project with significant upside. It is geologically consistent, metallurgically simple and technically low risk with a low capital intensity and significant future upside. We are proud to have been able to deliver this PFS within 3 years of discovery and our vision for the next year is to optimize and improve the project further and to continue to advance Twin Hills to the construction stage. We expect imminent, significant progress on the permitting & project financing side which will assist in continuing to fast-track the project”.
PFS Overview and Financial Analysis
The Twin Hills Gold Project is located within Namibia’s prospective Damara sedimentary mineral belt, in proximity to and along strike of the producing, open-pit Navachab and Otjikoto gold mines.
Twin Hills is a sedimentary-hosted, structurally controlled gold deposit that fits the broad orogenic model and is amenable to conventional open-pit gold mining and carbon-in-leach metallurgical processing.
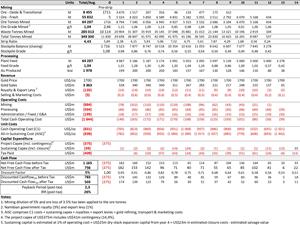
The table below summarizes the results and key valuation metrics of the PFS on a pre- and post-tax basis.
Table 1: Prefeasibility Study Economic Assessment Summary
| US$1700/oz | US$1850/oz | ||||
| Units | Pre-Tax | Post-Tax | Pre-Tax | Post-Tax | |
| NPV5% | US$m | 783 | 503 | 999 | 638 |
| IRR | % | 33% | 26% | 41% | 32% |
| Payback | Years | 2.2 | 2.3 | 1.9 | 2.0 |
| LOM Cashflow | US$m | 1165 | 756 | 1450 | 934 |
The financial model was completed on a 100% project basis and includes a 3% gross royalty and 1% export levy to the Namibian government. The economic analysis carried out for the Project uses a cash flow model at a base gold price of US$1,700/oz and a 5% discount rate.
A sensitivity analysis utilising a range of gold prices and operating variables was completed. The results are tabulated in table 4 on page 5.
The financial assessment of the Project was carried out on a 100% equity basis, not accounting for potential sources of funding which may include debt. Osino’s understanding of current Namibian tax regulations were applied to assess the tax liabilities.
The key operating assumptions and economic parameters used in the PFS are as follows:
Table 2: Key Operating Assumptions
| Item | Units | Amount |
| Life of Mine | Years | 13 |
| Gold price (base case) | US$/oz | 1 700 |
| Mining dilution | % | 5,0% |
| Ore loss | % | 3,5% |
| Gold Recovery | % | 92,0% |
| Royalty (tax-deductible) | % | 3,0% |
| Export Levy | % | 1,0% |
| Life-of-Mine Production Parameters | ||
| Ore Tonnes Mined | Kt | 64 287 |
| Ore Grade Mined | g/t | 1,04 |
| Ore Metal Mined (Proven & Probable Reserves) | Koz | 2 150 |
| Waste Tonnes Mined | Kt | 285 013 |
| Strip Ratio | 4,43 | |
| LOM Gold Production | Koz | 1 978 |
| LOM Average Annual Gold Production (years 1 – 10) | koz annum | 169 |
| Average Annual Gold Production (years 1 – 4) | koz annum | 200 |
| Life-of-Mine Unit Costs per Tonne Mined/Processed | ||
| Refining cost | US$/oz | 0.55 |
| Gold transport cost | US$/oz | 2.20 |
| Mining Cost (per tonne mined) | US$/t | 2,62 |
| Variable Processing Cost (per tonne processed) | US$/t | 8.97 |
| Fixed Processing Cost (G&A) | US$m/annum | 18,31 |
| Overall Processing unit Cost (per tonne processed) | US$/t | 12,45 |
| Unit Costs per Ounce Produced | ||
| LOM Average Operating Costs 1 | US$/oz | 831 |
| LOM Average Cash Costs 2 | US$/oz | 931 |
| LOM Average All-in Sustaining Costs 3 | US$/oz | 939 |
| Capital Costs | ||
| Construction Capital (Lycopodium Estimate) | US$m | 283 |
| Contingency (14,4%) | US$m | 41 |
| Capitalised Pre-strip | US$m | 22 |
| PV Plant | US$m | 20 |
| Grid power extra (additional to signed PSA) | US$m | 8 |
| First Fills (mostly steel balls) | US$m | 2 |
| Total Project Capital (incl. contingency) | US$m | 375 |
| Sustaining Capital | US$m | 74 |
Notes:
1. Mining, processing plus on-site G&A
2. Operating costs plus selling costs, royalties & levies
3. Cash costs plus sustaining capital (incl. closure costs & salvage value)
A summary of the production schedule in tabulated format and cash flow model with key economic results can be viewed in Figure 16 below.
It should be noted that there is scope for significant optimization and improvement to the mine design and production schedules which will be reflected in the next technical assessment of the project.
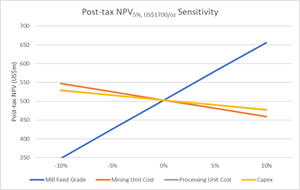
Sensitivity Analysis
An after-tax sensitivity analysis to the key project variables was carried out which indicates that the project is most sensitive to a change in grade or gold recovery, as indicated by the slope of the blue line in the diagram below.
At a stressed economic scenario of a gold price of US$1400/oz and an elevated discount rate of 10% the project still reflects a post-tax NPV of US$114m.
The project is most sensitive to changes in gold grade, with every 5% change in gold grade resulting in a change in NPV of around 15%. This is indicated by the slope of the blue line graph in the diagram below, which confirms that the project NPV is most sensitive to changes in the average gold grade.
Figure 1: Post-Tax Project NPV Sensitivity to Variations in Key Project Parameters at US$1700/oz
https://www.globenewswire.com/NewsRoom/AttachmentNg/6862aff1-0511-4aca-a5f5-d8a3a327ed71
Table 3: Two-factor Post-Tax Project NPV Sensitivity Analysis
| Discount Rate & Gold Price - Post-Tax NPV5% Sensitivity | ||||||||
| 1400 | 1500 | 1600 | 1700 | 1800 | 1900 | 2000 | ||
| 5% | 228 | 320 | 412 | 503 | 593 | 683 | 773 | |
| 6% | 202 | 290 | 378 | 464 | 550 | 636 | 721 | |
| 7% | 177 | 262 | 345 | 428 | 510 | 591 | 673 | |
| 8% | 154 | 235 | 316 | 395 | 473 | 550 | 628 | |
| 9% | 133 | 211 | 288 | 364 | 438 | 513 | 587 | |
| 10% | 114 | 189 | 263 | 335 | 406 | 477 | 548 | |
| Mill Feed Grade & Gold Price - Post-Tax NPV5% Sensitivity | ||||||||
| 1400 | 1500 | 1600 | 1700 | 1800 | 1900 | 2000 | ||
| 0,94 | 94 | 182 | 266 | 348 | 431 | 512 | 594 | |
| 0,99 | 162 | 252 | 339 | 426 | 512 | 598 | 684 | |
| 1,04 | 228 | 320 | 412 | 503 | 593 | 683 | 773 | |
| 1,09 | 293 | 389 | 485 | 580 | 674 | 769 | 863 | |
| 1,14 | 357 | 458 | 557 | 656 | 755 | 854 | 953 | |
| Mining Unit Cost & Gold Price - Post-Tax NPV5% Sensitivity | ||||||||
| 1400 | 1500 | 1600 | 1700 | 1800 | 1900 | 2000 | ||
| 2,36 | 273 | 365 | 457 | 547 | 637 | 727 | 817 | |
| 2,49 | 251 | 343 | 435 | 525 | 615 | 705 | 795 | |
| 2,62 | 228 | 320 | 412 | 503 | 593 | 683 | 773 | |
| 2,75 | 205 | 298 | 390 | 481 | 571 | 661 | 751 | |
| 2,88 | 182 | 276 | 367 | 459 | 549 | 640 | 730 | |
| Processing Cost (Variable) & Gold Price - Post-Tax NPV5% Sensitivity | ||||||||
| 1400 | 1500 | 1600 | 1700 | 1800 | 1900 | 2000 | ||
| 7,90 | 255 | 347 | 439 | 529 | 619 | 709 | 799 | |
| 8,34 | 241 | 334 | 425 | 516 | 606 | 696 | 786 | |
| 8,78 | 228 | 320 | 412 | 503 | 593 | 683 | 773 | |
| 9,22 | 215 | 307 | 399 | 490 | 580 | 670 | 760 | |
| 9,66 | 201 | 294 | 386 | 477 | 567 | 658 | 748 | |
| Construction Capex & Gold Price - Post-Tax NPV5% Sensitivity | ||||||||
| 1400 | 1500 | 1600 | 1700 | 1800 | 1900 | 2000 | ||
| -338 | 255 | 346 | 438 | 528 | 618 | 708 | 798 | |
| -356 | 241 | 333 | 425 | 516 | 606 | 696 | 786 | |
| -375 | 228 | 320 | 412 | 503 | 593 | 683 | 773 | |
| -394 | 215 | 308 | 399 | 491 | 581 | 671 | 761 | |
| -413 | 202 | 295 | 386 | 478 | 569 | 659 | 749 | |
Table 4: IRR Sensitivity to Gold Price
| IRR sensitivity to Gold Price | |||||||
| Discount | 1400 | 1500 | 1600 | 1700 | 1800 | 1900 | 2000 |
| 5% | 12% | 17% | 22% | 26% | 30% | 34% | 38% |
Mineral Resources Estimate
The PFS is based on the previously reported Mineral Resource block model reported on 9 August 2022, using a cut-off grade of 0.3 g/t Au, resulting in a Measured and Indicated Mineral Resource of 81.3 Mt at 1.08 g/t Au for a total of 2.83 Moz and an Inferred Mineral Resource of 7.2 Mt at 1.05 g/t Au for a total of 0.24 Moz.
A total of 212,184m of drilling from 1,016 holes (125,722m of diamond core from 451 holes and 86,462m of RC drilling from 565 holes) has been completed at Twin Hills since 2019 and was used for the Mineral Resource estimate.
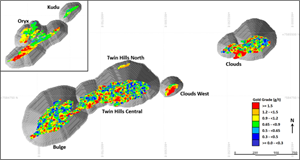
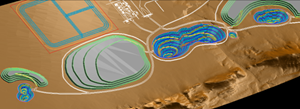
Sulphide-hosted gold mineralization was interpreted and modelled from a combination of structural and assay data for each of the Twin Hills mineralization domains (Figure 2). The primary mineralization, hosted in meta-greywacke, generally dips between 60° and 80° towards the northwest and ranges from a few meters to 200m in thickness.
The modelled mineralization includes mineralized intersections, with the geometry guided by local structural trends. A 0.4 g/t Au threshold was used to model the mineralized volumes however a 0.3 g/t Au threshold was used for Twin Hills North for continuity purposes. Most modelled mineralization is overlain by a barren calcrete layer.
Gold grade was estimated using localized uniform conditioning (LUC) at Bulge, Twin Hills Central and Clouds from 2m composites into 60m x 60m x 5m (XYZ) panels and 5m x 5m x 5m selective mining units (SMU). Ordinary kriging was used for grade estimation at Clouds West, Twin Hills North, Kudu and Oryx.
Figure 2: Plan view showing mineralized material in the US$1800/oz reporting pit shell above 0.3 g/t Au
https://www.globenewswire.com/NewsRoom/AttachmentNg/6fcf0b16-dc8c-473e-ba82-287ffb085ea5
Mineral Resource Statement
The mineral resource is that material within the reporting pit shell above a 0.3 g/t Au cut-off grade. The mineral resource estimate ("MRE") has an effective date of July 25, 2022 (Table 1), and a corresponding technical report disclosing the mineral resource estimate in accordance with NI 43-101 will be prepared for the Company by Mr. Anton Geldenhuys of CSA Global (Pty) Ltd., who is an independent qualified person under NI 43-101. The Company will file the technical report on SEDAR under its profile at www.sedar.com within 45 days of the date of the news release that announced the MRE on August 9, 2022.
Table 5: Mineral Resource for the Twin Hills Gold Project at a 0.3 g/t Au cut-off as July 25, 2022
| Category | Tonnes | Grade | Troy Ounces |
| (millions) | (g/t Au) | (millions) | |
| Measured | 0.7 | 1.60 | 0.04 |
| Indicated | 80.6 | 1.08 | 2.80 |
| Measured & Indicated | 81.3 | 1.08 | 2.83 |
| Inferred | 7.2 | 1.05 | 0.24 |
Notes on mineral resource reporting:
- Figures have been rounded to the appropriate level of precision for the reporting of mineral resources. Mineral resources are stated as in situ dry tonnes. All figures are in metric tonnes.
- The mineral resource has been classified under the guidelines of the CIM Definition Standards for Mineral Resources and Mineral Reserves and adopted by the CIM Council, and procedures for classifying the reported mineral resources were undertaken within the context of the Canadian Securities Administrators NI 43-101.
- The mineral resource is reported within a conceptual pit shell determined using a gold price of US$1,800/oz and conceptual parameters and costs to support assumptions relating to reasonable prospects for eventual economic extraction:
- 4% royalty (3% government royalty and 1% export levy)
- Selling costs of US$2.75/oz Au
- Mining costs of US$2.00/t mineralized material and US$1.85/t waste, with additional cost attributed to depth below surface
- Processing and rehandling costs of US$8.15/t run of mine mineralized material
- G&A cost of US$4.00/t run of mine mineralized material
- Slope angle of 48° in weathered rock and 55° in fresh rock
- 90% recovery of Au from CIL circuit
- Mineral resources that are not mineral reserves do not have demonstrated economic viability.
- The exclusive prospecting licenses (“EPL’s”) on which the mineral resource is reported, are 90%, 100%, 95% and 90% owned by Osino. As a result, the blended ownership of the total reported gold ounces attributable to Osino is 94.5%. The Company has entered into agreements to acquire the minority interests to increase Osino's ownership to 100% (see Osino news release dated August 16, 2022).
Mine Design and Production Schedule
The PFS has been conducted using the updated Mineral Resource for the Twin Hills Gold Project prepared by independent qualified person, Mr. Anton Geldenhuys of CSA Global Mining Industry Consultants (“CSA”). The study complies with guidelines as defined within NI 43-101 Standards of Disclosure for Mineral Projects for a PFS, a professional code of practice that sets minimum standards for Public Reporting of minerals Exploration Results, Mineral Resources and Ore Reserves and the estimates have been prepared by appropriately experienced and qualified competent persons with a thorough knowledge of the operation.
Inferred resources were excluded from the pit optimisation runs and the Reserve statement and were classified as waste during the LOM production schedule runs. The deposit is a large, shallow gold deposit that is amenable to bulk open pit mining.
The Whittle pit optimisation was run at a base gold price of $1,700 per ounce gold and a 5% discount rate and includes a 3% gross royalty and 1% export levy to the Namibian government. Stated below in Table 6 are the major assumptions used to generate the Twin Hills Gold Project PFS Mining Study.
Table 6: Mine Planning and Whittle Pit Optimisation Assumptions
| Parameter | Units | Values |
| Base Currency | USD | |
| Base Date | Q1 2022 | |
| Exchange Rate – real | (NAD : USD) | 15.50 |
| Discount Rate (for NPV calculation) | (%) | 5.00% |
| Base Gold (Au) Price – real | (USD/oz) | 1 700 |
| Government Royalty (3%) + Export Levy (1%) | (%) | 4.00% |
| Selling Costs - Gold Refining Costs | (USD/oz) | 0.55 |
| Selling Costs - Gold Transport Costs | (USD/oz) | 2.20 |
| SMU Block Size | X(m) x Y(m) x Z(m) | 5 x 5 x 5 |
| Mining Dilution | (%) | 5.0% |
| Mining Recovery (Ore Losses) | (%) | -3.5% |
The orebody will be mined as a conventional shovel and truck operation, with bulk mining augmented by more selective mining in areas with narrow ore zones.
It was assumed that mining would take place by conventional open pit methods and that the whole mining operation, except for the mine technical services function, would be outsourced to a reputable mining contractor company. This includes drilling, blasting, loading and hauling of ore and waste.
The mining contractor will be responsible for the supply of all materials, equipment, facilities and services, supervision and labour necessary to carry out the mining operations in accordance with the mining contract specifications.
Drilling and blasting will be performed on 10 m high benches. Waste benches will be excavated in a bulk mining fashion with shovels on a single 10 m bench while mineralised benches will be selectively loaded in two 5m flitches using backhoe excavators to minimise ore loss and dilution.
The truck and shovel match on the ore and waste benches have been considered and are planned as follows:
- 130-t hydraulic backhoe shovel to be employed for selective loading purposes.
- 250-t hydraulic face shovels will be utilised to load the full 10 m bench. The waste benches will be mined in a bulk mining approach where the face shovels will be utilised to load the full 10 m bench.
- 100-t capacity, off-highway rigid haul trucks will be used, and standard open-pit drilling equipment will be required.
Ore and waste will be loaded with hydraulic excavators and hauled by diesel-powered trucks to the primary crusher, ROM pad stockpiles, low-grade stockpiles or waste rock dumps. The remainder of the mining production fleet consists of support equipment that includes graders, track and wheel dozers, front-end loaders, rock breakers and utility excavators.
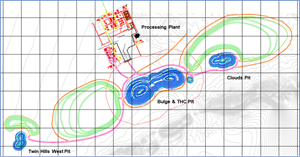
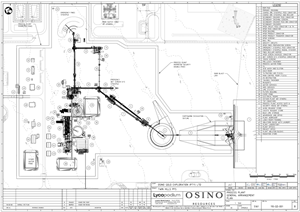
Figure 3: Design, Layout and Location of Process Plant, Pit and Waste Rock Dumps
https://www.globenewswire.com/NewsRoom/AttachmentNg/7793dbfb-1ff9-4531-8b6c-12a61890828a
The objective of the pit design process was to transform the pit shells obtained from the optimisation into a practical pit, with the inclusion of ramps, bench and berm configurations by taking all the required inputs into account. The practical pit design is the most important input for the scheduling and reserve determination process.
The project is planned as a multi-pit mining operation, as shown in Figure 4, with seven pushbacks in the Central Twin Hills / Bulge pit design and three separate satellite pits (Clouds, Clouds West and Twin Hills West) to be mined in different phases throughout the LOM. The pit design and scheduling has been undertaken to allow for interim pushbacks which will be mined early, thereby allowing higher grade to the plant to be maximised in the early years, and waste stripping is deferred as far as possible into the future.
Scheduling of waste stripping and ore mining within the various pushbacks will focus on optimising the plant feed grade while ensuring ROM stockpile capacity as far as possible. The stockpile strategy is to maintain at least two months of ROM ore on finger stockpiles to allow for flexibility in blending to optimise recovery and plant throughput. The processing plant will continue to process lower-grade stockpiles after open-pit mining comes to an end.
Table 7: Declared Twin Hills Gold Project Reserves as of 31st of August 2022 (gold cut-off grade of 0.3 g/t)
| Mine Project | Classification | Tonnes (Mt) | Grade (g/t) | Contained Metal (Moz) |
| Twin Hills Gold Project | Proven | 0.75 | 1.46 | 0.035 |
| Probable | 63.54 | 1.04 | 2.115 | |
| Total Ore Reserve | 64.29 | 1.04 | 2.150 |
The Twin Hills Gold Project Reserve estimate has been determined and reported in accordance with the guidelines provided by NI 43-101 Standards of Disclosure for Mineral Projects. The Ore Reserve was determined as of the 31st of August 2022 based on a gold cut-off grade of 0.3 g/t and is summarised in Table 7 above.
The final Twin Hills Gold mine production schedule was produced with maximum material movement of 42 Mtpa, providing approximately 13 years’ supply of ore at 5 Mtpa.
Figure 4: Design, Layout and Location of Process Plant, Pit and Waste Rock Dumps
https://www.globenewswire.com/NewsRoom/AttachmentNg/55c7e183-0b20-4a79-8b5c-91043835ad13
The figures below summarize the LOM production schedule and key production metrics.
Figures 5-8: Stripping Ratio, Mill Feed, Gold Production and Stockpile Schedules
https://www.globenewswire.com/NewsRoom/AttachmentNg/f31e9f88-8230-4005-9cbd-d9471f591511
https://www.globenewswire.com/NewsRoom/AttachmentNg/ca1119de-521a-418e-aa24-c0f220655229
https://www.globenewswire.com/NewsRoom/AttachmentNg/edb00690-a30b-48df-b368-8fec8a29ad98
https://www.globenewswire.com/NewsRoom/AttachmentNg/fa66f758-8bfa-452b-ba38-f421a8e7bddb
The pre-strip period is 6 months with a total of 11.83 Mt mined from the first two pushbacks. After the pre-strip period, the ore inventory on the grade control and ROM stockpiles is 1.72 Mt. The plant production ramp-up is three months after commissioning.
All pre-strip (start-up) production costs up to processing plant commissioning were regarded as capital costs. This encompasses contractor mobile plant, fixed facilities and personnel mobilisation costs. It also caters for the establishment costs of the owner team management and technical services department.
A summary of the production schedule in tabulated format and cash flow model with key economic results can be viewed in Figure 16.
Table 8: Key mining parameter results
| Key mining parameters | Unit | Total / LOM |
| Operations | ||
| Mining pre-strip period | Months | 6 |
| Mine production life | Years | 11 |
| Processing production life | Years | 13 |
| Mining | ||
| Ore mined | Mt | 64.29 |
| Strip ratio | X | 4.4 |
| Waste mined | Mt | 285.01 |
| Processing | ||
| Ore processed | Mt | 64.29 |
| Average gold head grade | g/t | 1.04 |
| Average CIL gold recovery | % | 92.0% |
| Output | ||
| Gold production | M oz | 2.00 |
| Mining start-up CAPEX | M USD | 11.2 |
| Mining Opex (average) | USD/t | 2.61 |
Metallurgical Testwork
In August 2020, Lycopodium was commissioned to manage a metallurgical test work program, undertaken by Maelgwyn Mineral Services Africa) (Pty) Ltd. (“Maelgwyn”) as part of the PEA. Test work on samples from core drilling of different sections of the ore body, and with a spread of gold grades was completed in June 2021 including the following test work and preliminary results:
- Mineralogical investigation of ten samples showed that several sulphide minerals were present, including pyrrhotite, pyrite and arsenopyrite.
- Crushing and milling tests indicated that average power consumption for the comminution section at the target grind of 80% passing 53 micron was expected to be 17.1 kWh/t. A circuit including 3 stages of crushing followed by ball milling was proposed.
- Grind vs recovery testwork showed an average increase in gold recovery across all mineralized material types of about 5.3% compared to a grind size of 80% passing 75µm.
- Leach tests conducted at 50% solids with 1kg/t cyanide addition indicated that pre-oxidation improved subsequent gold leach recoveries by several percent for most material types.
- Leach kinetics testwork confirmed that gold recovery continued to increase when leach retention time was increased from 24 to 48 hours.
- Tailings thickening tests produced flux rates considered to be within the standard range for similar operations.
Average gold recovery results from samples at a grind size of 80% passing 53µm with pre-oxidation at different leach times were:
Table 9: Gold Recovery Results at different Leach times
| Leach Retention Time | 24 Hour | 48 Hour |
| Fresh Rock Sample | 89.2% | 90.7% |
| Oxide Rock Sample | 92.1% | 93.9% |
Following the completion of the PEA, Lycopodium was appointed to initiate and oversee several additional phases of core and composited sample tests using Maelgwyn for the testwork and OMC for crushing and milling simulations. These tests were carried out between October 2021 and July 2022 included samples from additional locations in the mineral resource as well as samples from the “Clouds” and “Twin Hills West” areas and comprised the following:
- Crushing and milling tests on 37 individual samples.
- A similar suite of leach tests as those completed during the PEA, but supplemented by:
- Semi-quantitative mineralogical analysis using X-Ray diffraction;
- Simulation modelling of the crushing and milling circuit at nominal plant feed rate of 5 Mtpa of fresh ore but also taking into account annual variations resulting from the presence of some relatively soft oxide or transition ore in the plant feed.
- Diagnostic leaches to confirm the reasons for gold losses to leach tails;
- Gravity recovery followed by cyanide leaching of gravity tails;
- Grind versus recovery tests at 80% passing 75, 63 and 53 micron;
- Pre-oxidation and reagent optimisation tests;
- Leach tests using site water;
- Flotation tests followed by leaching of rougher concentrate;
- Cyanide de-toxification tests;
- Tailings settling and filtration tests;
- Solids and slurry material flow tests;
All of these tests except the final variability tests were completed in time with the following key results:
- Three stage crushing followed by ball milling was retained, with a high-pressure grinding roll unit (HPGR) being specified as the tertiary crusher. Specific power consumption for the HPGR/milling circuit over the whole life of mine was calculated to be 17 kWh/t to achieve a target grind of 80% passing 63 micron.
- Gravity recovery tests including upgrading of concentrate to simulate plant conditions confirmed that the average gold recovery would be about 25%.
- Use of site water (instead of tap water) had no effect on leach performance.
- Pre-oxidation tests indicated that a 2-pass shear reactor with 4-hour retention time should be used ahead of 24 hours of cyanide leaching at pH 10.5 with cyanide concentration maintained at 500 g/t and with 20 g/l carbon addition produced very good results. The circuit total gold recoveries (including gravity recovery) modelled for different ore zones from the test results are summarised below:
Table 10: Overall LOM Average Gold Recovery for Different Pits
| Material | Pit | Overall Circuit Recovery % |
| Transition | Bulge | 92.7 |
| TH Central | 92.7 | |
| Clouds | 92.7 | |
| TH West | 92.7 | |
| Fresh | Bulge | 91.0 |
| TH Central | 93.9 | |
| Clouds | 88.0 | |
| TH West | 88.0 | |
| Total (All) | 92.0 |
Approximately 0.6% reduction against these figures will occur in the plant operation due to loss of leached solution containing residual gold to the tailings storage facility.
Tailings settling tests confirmed the PFS results. Filtration tests on thickener underflow demonstrated that tailings filter cake containing about 23% moisture on average could be generated for disposal, to reduce plant water consumption.
Plant Mineral Processing
The Twin Hills process plant will have nameplate capacity of 5.0 Mtpa of ore and a nominal capacity of 649 tonnes per hour (tph). A design contingency has been applied to major equipment and most of the plant has been designed for the volumetric requirement of 5.3 Mtpa of partially weathered ore in the early years of operation, at 45% solids in the leach circuit.
Gold recovery will be achieved using a 3-stage crushing, ball milling, gravity, pre-oxidation, carbon-in-leach (“CIL”), cyanide detoxification and tailings thickening and filtration process plant flowsheet. The process is based on conventional unit operations well proven in the industry and will achieve high recoveries from all major rock types that are planned to be processed.
Several trade-off studies of alternative possible process configurations were conducted, such as: primary jaw versus gyratory crusher, a standard Primary Crusher/Stockpile/SAG Mill/Ball Mill/Pebble Crusher circuit, a flotation circuit ahead of leaching, pre-oxidation with lead nitrate, conventional tailings thickener underflow disposal and pressure filtration of tailings. The current flowsheet was selected in preference to these alternatives.
Figure 9: Schematic Process Plant Layout
https://www.globenewswire.com/NewsRoom/AttachmentNg/6f01c81d-fd18-42e0-bc8b-51bee0c787de
The detailed plant flow diagram is depicted in Figures 12 and 13 below.
The mine production schedule developed for the PFS allows for most of the ore to be direct tipped with the remainder being rehandled into the crusher by a front-end loader. The process plant will comprise the following circuits:
- Primary gyratory and secondary cone crusher designed for a throughput of 815 (dry) tph.
- Crushed coarse ore stockpile, which provides total capacity of 9,800 tonnes.
- HPGR in a tertiary crusher role but able to operate with 88% availability, with product screen undersize feeding the mill feed conveyor. The HPGR will normally operate at slightly higher production rate than the downstream ball mill. The excess material will be placed on a stockpile that can be used to feed the mill if the HPGR has an unexpected production stoppage.
- A ball mill and classification circuit with throughput capacity of 5 Mtpa of ore at design grind of 80% passing 63micron.
- Gravity concentration of a portion of the cyclone underflow to recover liberated gold, followed by in line leaching and electrowinning of the gravity concentrate.
- A leach feed thickener to increase milling circuit classification efficiency and reduce the volume required in the leaching circuit.
- A pre-oxidation tank with 4 hours retention time of thickener underflow, supported by an oxygen plant and proprietary shear reactor oxygen injection technology.
- A conventional CIL circuit consisting of seven leach-adsorption tanks to achieve the 24 hours target residence time.
- A cyanide destruction circuit followed by tailings thickening and vacuum belt filtration.
- Gold recovery and refining consisting of an elution circuit, electrowinning cells and smelting.
- A double-lined, dry-stack tailings storage facility constructed adjacent to the process plant for deposition of the process plant tailings as stacked filter cake. It is expected all contained solution will be evaporated preventing any possibility of it being recycled to the plant.
Capital & Operating Cost Estimate
The overall Project capital cost estimate was compiled by Lycopodium, including the cost estimates for a 5mtpa process plant targeting a grind size of 80% passing 63µm. Additional input was sourced from specialists on the tailing storage facility, open pit mine, power supply and non-process infrastructure and Osino have provided project specific estimates of Owner’s costs.
Table 11: Summary of Capital Cost Estimate
| Capital Cost Estimate | Unit | Capital Cost | |
| 1 | Treatment Plant Costs | US$m | 119,6 |
| 2 | Reagents & Plant Services | US$m | 22,7 |
| 3 | Infrastructure | US$m | 83,7 |
| 4 | Mining | US$m | 11,2 |
| 5 | Construction Deliverables | US$m | 22,7 |
| 6 | Freight | US$m | 10,1 |
| 7 | Opening Stock (First Fill) | US$m | 2,0 |
| 8 | Solar Plant | US$m | 20,0 |
| 9 | Additional Grid-power Connection | US$m | 7,5 |
| 10 | EPCM | US$m | 20,4 |
| 11 | Owners Costs | US$m | 19.9 |
| Total capital cost excl. contingency | US$m | 334,2 | |
| 12 | Estimated Contingency @ 14,4% | US$m | 40,8 |
Process operating costs have been developed by Lycopodium for the life of mine (LOM) blend of mineralized material blends specified by Osino based on the mining and processing schedules developed by the mine planners.
The processing variable operating costs shown in Table 12 have been developed for a plant with an annual throughput equivalent to 5mtpa of fresh mineralized material plant feed at a grind size of 80% passing 63 µm, based on a 24 hour per day operation, 365 days per year.
Table 12: Processing Cost Estimate (blended Life of Mine Estimate)
| Plant Ore Feed (t processed per year) | 5,000,000 | |
| Cost Centre | US$m/year | US$/t ore |
| Power | 15,7 | 3.13 |
| Operating Consumables | 28,1 | 6,62 |
| Maintenance | 2,7 | 0,53 |
| Laboratory | 1,5 | 0.30 |
| Process Plant Labour | 3,7 | 0.73 |
| Total Processing | 51,6 | 10,32 |
Mining operating costs were estimated based on the envisaged mining contractor’s selected equipment fleet and organisational structure. The estimate was done from first principles, using the original equipment manufacturers hourly life cycle cost estimates with the simulated production rates for the primary mining equipment.
Administrative costs were developed by other specialist consultants (non-process infrastructure and power supply, tailings storage facility) or by Osino (G&A labour and expenses). In all cases, the estimates were developed from first principles.
Some reduction in operating costs is shown after the first year of operation in the financial cash flow schedules. There are three reasons for this. First, the solar PV plant should be able to supply more than 25% of the total power. Second, maintenance costs should decrease slightly as the very high current fabrication costs for steel balls and freight costs in general decline to normal long term market related costs. Finally, some of the labour costs for expatriates should decrease once more Namibian personnel have been trained.
The unit operating cost estimates thus derived are summarized in Table 13 below:
Table 13: Plant Operating Cost Estimate Summary
| Cost Centre | Total Operating Cost | Proportion of Operating Cost | |
| US$/year | US$/tonne ore | ||
| Operating Consumables | |||
| Crushing Plant | 480 269 | 0,10 | 0,8% |
| Milling Plant | 12 007 317 | 2,40 | 19,3% |
| Pre-Leach and CIL | 8 789 796 | 1,76 | 14,1% |
| Cyanide Destruction | 1 212 774 | 0,24 | 1,9% |
| Thickening and Filtration | 2 882 689 | 0,58 | 4,6% |
| ADR and Gold Room | 2 439 287 | 0,49 | 3,9% |
| Miscellaneous | 283 997 | 0,06 | 0,5% |
| Subtotal Processing Consumables | 28 096 131 | 5,62 | 45,1% |
| Plant Maintenance | 2 661 153 | 0,53 | 4,3% |
| Laboratory (Plant) | 1 508 253 | 0,30 | 2,4% |
| Solar Power (43,3 GWh per year from Osino) | 259 800 | 0,05 | 0,4% |
| Grid Power (Plant) | 15 401 307 | 3,08 | 24,7% |
| Labour (Plant Operations & Maintenance) | 3 652 723 | 0,73 | 5,9% |
| Subtotal Plant Costs | 23 483 235 | 4,70 | 37,7% |
| Total Processing Variable Costs | 51 579 366 | 10,32 | 82,9% |
| General & Administrative Labour | 4 926 902 | 0,99 | 7,9% |
| General & Administrative Power | 844 853 | 0,17 | 1,4% |
| General & Administrative Expenses | 1 704 223 | 0,34 | 2,7% |
| Infrastructure Items transferred from Capex | 1 558 048 | 0,31 | 2,5% |
| Tailings Storage Facility Operating Cost Estimate | 1 616 227 | 0,32 | 2,6% |
| Total Plant G&A including Site Infrastructure & CDF | 10 650 253 | 2,13 | 17,1% |
| Total Processing Cost (Excluding Contract Mining) | 62 229 619 | 12,45 | 100,0% |
In the cash flow schedules for the PFS, the processing plant operating costs are expressed as US$ 8,78/t variable cost plus US$18,31 million fixed costs per year. The annual total of these is equal to US$12,45/t processed, as shown in the table above.
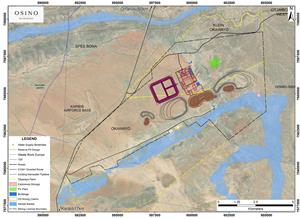
Site Location and Infrastructure
The Twin Hills Project is in central Namibia approximately 20km’s from the local town of Karibib, and 150 km from the capital city, Windhoek. The Project area has access to excellent infrastructure by being in close proximity to Namibia’s well-maintained national rail, road and bulk utilities network.
The Project is located within 5km’s of the sealed national highway network, within 20km’s of a major high tension overhead power line and within 220km’s of the modern seaport of Walvis Bay, to the west of the Project, which is the main logistical port supplying the mining industry in the region. The Project is also within 30km’s of the well-established Navachab gold mine, which has been in consistent production since 1989.
The Project is located in arid shrub land and is characterised by moderate relief with local elevations ranging from 900 m to 1,500 m above sea level. The primary economic activities in the Project area are agricultural (cattle ranching and game farming). Local elevations or hills in the Project area are generally associated with marble outcrops and granitic intrusions.
The anticipated infrastructure for the Project includes mine dry facilities, equipment maintenance workshop, refuelling facilities, explosive magazine, office administration facilities, assay laboratory, and warehouse facilities. As well as access roads, stockpiling areas, storm water handling facilities, water supply, power supply network, diesel generators, sewage treatment plant, and waste management facilities. Given the Project’s proximity to the town of Karibib, it is assumed that no onsite accommodations will be required. Accommodations for expatriate and some senior staff may be provided through rental houses in the town of Karibib.
The Project power average demand has been estimated at about 22 MW, most of which will be supplied from the Namibian grid by a high-voltage overhead powerline to the site switchyard. The national grid connects to the town of Karibib with a 66kV line, which also supplies the Navachab gold mine. Osino has signed an agreement with the national power utility, NamPower, to connect the planned operation into the high voltage power grid. To supplement the grid power, a study has been completed for a photovoltaic solar power installation on site with the capability to supply approximately 25% of the Twin Hills requirement. The advantage of this is a much lower operating cost for the solar power than the average rate for grid power.
Field investigations have informed the optimum site layout for the plant, waste dumps and tailings facility. Refer to Figure 9 above for the detailed site layout.
Hydrogeological Modelling and Water Supply Studies
The Twin Hills project is characterized by arid conditions with a rainfall season spanning generally from December to March/April. Precipitation is generally short and of higher intensity also known as flash flood rainfall events. The mean annual rainfall is 268 mm, although drought periods in Namibia can last several years.
The site topography is characterized by a gentle valley sloping in a southeast to north-west direction towards the Khan River, a tributary to the Swakop River which flows towards the Atlantic Ocean. All rivers and tributaries are ephemeral. The Okawayo river, a tributary to the Khan river, crosses the site infrastructures and particularly the main open pit area. The Okawayo catchment area upstream of the pits is approximately 92 km2 running over a watercourse length of 28 km, and an overall slope of about 1%.
A hydrogeological study was completed from 2020 to 2022 to determine the open pit dewatering requirements as well as the groundwater resources that may be available for mine water supply. Initial work comprised of geophysical surveying and borehole drilling to identify potential dewatering/water supply targets considered to have the highest permeability, followed by pump testing to confirm actual sustained yield of selected boreholes.
The results of the drilling and testing confirms that the groundwater flow is controlled primarily by lithology and structures. The weathered and exposed upper contact of the Karibib Marbles and younger brittle faults orientated NNW to SSE has the highest water bearing potential. The ore zone in the mica schists of the Kuiseb Formation has low permeability associated with the northeast-southwest foliation. A shallow alluvial aquifer is well developed along the Khan River which is used as water supply to the region.
Groundwater flow is towards the north-west and the Khan River as the receiving water body from an elevation of 1400 mamsl in the Karibib marbles to the south of the mine pits and 1000 mamsl at the Khan River. Groundwater levels are deeper in the mica schists (> 20 mbgl) to just below surface elevation 4 mbgl in the alluvial aquifers associated with the Khan River. A sub-tributary drainage to the Khan River is the north south orientated Okawayo non-perennial stream that passes through the eastern boundary of the Main Pit.
Figure 10: Conceptual Hydrogeological Model for Twin Hills
https://www.globenewswire.com/NewsRoom/AttachmentNg/7a220984-49b0-4836-9b81-42f46783edac
Five boreholes have been drilled and two test pumped within the mica schists around and within the proposed open pit footprints. Groundwater is localised in these zones and dewatering requirements are considered to be manageable from in-pit sumps. The geotechnical rock mass ratings are generally high and the risk of excess pore pressures in weak rock mass has not been flagged as a requirement for depressurisation design work at this stage.
The groundwater quality quantified by the Total Dissolved Solids (TDS) ranges from 300 mg/L in the Karibib marble aquifer to > 3000 mg/L in the Kuiseb mica schists. Active recharge from precipitation occurs in the karstic and silicified marble hills with bicarbonate as the main anion and calcium as the major cation. There is less recharge to the mica schists resulting in higher concentrations of sodium and sulphate in these groundwater samples.
The groundwater potential as part of the mine water supply is estimated at 3000 m3/day based on the drilling and testing to date and includes the water supply potential in a conceptual managed aquifer recharge (MAR) scheme in the Khan River alluvials. Most of the mine water supply boreholes tested along the northeast - southwest striking Karibib marble contact are hydraulically interconnected and the opportunity to recharge this aquifer via MAR along the Okawayo sub-tributary is under consideration.
Figure 11: Life-of-Mine Pit Dewatering Inflow Calculations
https://www.globenewswire.com/NewsRoom/AttachmentNg/16705f45-fffb-43dc-8bc0-82c97638ec98
A numerical flow model is being developed in FEFLOW for steady state and transient conditions. The preliminary model outputs have a 30% level of confidence (PFS) level based on the data collected to date. Estimates of groundwater inflows to the pits were calculated over the Life of Mine (LOM) as per the mining plans and schedule provided. Estimates of groundwater flow range from < 500 m3/day in Year 1 increasing to a cumulative maximum of 4000 m3/day in Year 10 when all three pits (Main, Cloud and West) are in operation.
Active dewatering boreholes have not been included, as the passive inflows can be managed from in-pit sumps. Modelling excludes direct precipitation and runoff to the pits and evaporation from the pit high walls will minimise the ingress, likely to result in lower pumping requirements.
The conceptual management of the Okawayo seasonal flows in an attenuation dam/sand dam upgradient of the mine pits, will have the dual purpose of recharging the marble contact aquifer (for mine water supply) and minimise ingress to the pits. The cone of drawdown will be elongated towards the NE-SW along strike of the orebody and parallel to the Karibib marble contact.
Mine Water Supply
The site water balance based on a process throughput of 5.3 million tonnes per annum (Mtpa) has a water demand of approximately 1.8 Mm3/yr. The process design aims to maximise the re-use of water by recycling process solutions wherever possible through filtration systems in the plant.
It is assumed that approximately 77 % of the water contained in tailings is recycled at the plant and the remaining water is lost in the filtered tailings cake sent to the tailings storage facility. The water balance assumed that a portion of the demand would be lost at the plant and a further amount used for dust suppression. It assumes full evaporation rates at the open pits at start of operation. The site water balance indicates that the processing cycle is in a water deficit and requires water from external source such as fresh water, groundwater or other recycled source.
Several options are advanced to supply additional mine make up water to compensate for the water deficit but also to alleviate reliance on a single source supply. The following options are envisaged for surface water supply to the mine:
- Groundwater borehole pumping along the Karibib marble to supply approximately 3000 m3/day, or 1 million m3/yr. This option is discussed in the sections above and estimated values are based on sustainable yields tested during the 2022 field program.
- Karibib wastewater scheme supply: This option could supply up to approximately 150,000 m3/pa at current population estimate to 200,000 m3/pa depending on the population growth.
- Khan River sand and river dams with groundwater recharge sites to increase the sustainability of abstraction conveyed to site through a pipeline.
- Okawayo flood attenuation dam and groundwater recharge scheme: The potential long-term yield of this option is still to be investigated and is also likely to increase sustainability of the groundwater options while supporting pit dewatering.
- NamWater scheme bulk supply: Freshwater sourced from the Swakoppoort Dam, conveyed to the Okangava reservoir and to Karibib and site through a pipeline. Application to purchase water from the scheme were submitted by Osino and are currently under evaluation by NamWater.
The potential of the Khan and Okawayo river groundwater recharge schemes sustainable yields are to be further investigated and confirmed. Water supply from these options are envisaged as longer term strategy to lower reliance on national water schemes.
Mine Power Supply
In March 2022 Osino signed a power-supply agreement (“PSA”) with Namibia’s parastatal power utility NamPower (Pty) Ltd (“NamPower”). The agreement is to supply a minimum of 16MW through a dedicated 66kV feeder bay and overhead lines from the new Erongo substation at Karibib town, approximately 20km’s from the project site. Under the terms of the agreement Osino has an option to pay 30% (NAD 8.56m) of the capital costs as an initial deposit and the remaining 70% divided into five equal payments of NAD 4.1m during the supply and construction period, with specific dates to be agreed once the start of the project timeframe has been determined.
The terms of the agreement also stipulate that grid power supply is subject to a 36 to 48-month NamPower procurement and construction lead time. Following the first deposit payment Osino will engage NamPower to shorten the procurement period and manage parts of the construction and implementation of the connection.
Osino intends to fast track the development of the substation and transmission infrastructure in line with the project development timeframe. The enhanced PFS processing plant capacity has seen the maximum power demand grow in line with a larger crushing circuit and mill, to approximately 22MW. Discussions with NamPower will also include updating the agreement to cater for the additional expected demand.
In addition to more grid power supply Osino has engaged a specialist consultancy to assist in designing and procuring large-scale photovoltaic power supply in addition to grid power. The study has undertaken various trade-offs and determined that a 20 MWp PV configuration would be the preferred option showing optimum results for a 30% renewable energy share. Capex of US$20m has been included to cater for this option in the base case. Additional power storage via battery or hydrogen power will be investigated as part of the DFS studies. It is assumed that during the construction phase power will either be sourced from the planned solar installation, or from the regional 33Kv grid connection via the local distributor, Erongo Red.
Risks & Opportunities
A number of significant project improvement opportunities have been identified as part of this PFS, including the following:
- A key project risk is water supply. In order to mitigate this risk Osino has confirmed the long-term supply potential from the nearby aquifers in limestone formations, has included costs to upgrade the Karibib water treatment plant and pump water from there to site, and has modelled the expected significant quantity of excess pit water after approximately year 4 of the mining schedule.
- An additional key project risk is the 36 to 48-month NamPower grid power procurement and construction lead time. Once the initial grid power deposit payment under the signed PSA has been made (expected Q4 2022) Osino intends to investigate various alternative options to accelerate the grid power procurement and construction lead time.
- Test work showed that some arsenic is dissolved in the process. A side study was completed during the PFS confirming that this can be precipitated and removed. Arsenic in filtered tailings in this arid region is not expected to be exposed to fresh water and should not be leached in situ, but even if it is the double lined tailings storage facility will contain any solution produced.
- Additional metallurgical testwork especially related to the Clouds and Twin Hills West may result in improved overall gold recovery from these specific portions of the ore body, and the variability tests currently in progress should instil even more confidence in the results achieved to date.
- A value chain optimisation exercise currently in progress will ensure that the objectives and production plans of the mining and processing activities are aligned and focused on maximising value. A review of the design criteria for the recently completed PFS will enable Osino to quantify any possible additional capacity from the current design, which would influence the optimum mining, stockpiling and processing schedule.
- The solar power investigations revealed that there is potential for additional operating cost savings if the percentage of renewable power can be increased beyond 30%.
- Alternative tailings stacking designs may enable deferral of capital and reduction of operating costs.
- Opportunities for capital and operating cost reductions have been identified during the PFS, but with no time for them to be investigated. There is an opportunity to downgrade some of the infrastructure design proposals for buildings and other items.
- The conceptual pit shell used to report the Mineral Resource to satisfy RPEEE, resulted in the majority of the block model being reported as Mineral Resource. This suggests that undrilled material below the current RPEEE pit shell could potentially satisfy RPEEE requirements and that the deposit is effectively open at depth.
- It is reasonable to expect that majority of the Inferred Mineral Resources could be upgraded to Indicated Mineral Resources with continued infill drilling.
Proposed Project Development Plan
Osino’s intention is to continue to fast-track the development of the Twin Hills project. The steps expected include the following main activities:
- Proceed with a definitive feasibility study (DFS) starting before the end of 2022. Duration of this is expected to be about four months and the study will be based on the flowsheet and design concepts developed for the PFS. A major deliverable will be cost estimates with an accuracy range of approximately ± 15% based on further development of the engineering designs.
- Commence with a front-end engineering design (“FEED”) package to start before the end of the DFS and to be based on the DFS design work. The main objectives of the FEED exercise will be to advance basic engineering designs to the point at which conditional orders for major long lead items can be placed, to obtain certified vendor drawings, to establish the core project implementation team, to set up the design procedures for project implementation and to enable preparatory earthworks to commence on site.
- A small Owner’s Project team will be appointed by the start of the FEED contract. They will have some responsibilities for coordination of the project implementation contractors but will also be responsible for planning and beginning the implementation of the Operational Readiness set up activities for the future mine and plant operation.
- As soon as Project Finance is available, preferably by the time the FEED contract is completed, project implementation will commence. The main project development contract to put in place will be for design, procurement and construction of the 5 Mtpa process plant. It is currently intended that this will be a reimbursable EPCM (engineering, procurement and construction management) contract. The EPCM contractor will be responsible for the delivery of the project according to the agreed schedule and within the capital cost budget but will work very closely with the Osino Owner’s team in this contractual model.
- It is intended that this principle will also be applied to the bulk power supply and the site infrastructure to ensure that everything needed for the project to be commissioned on time is under Osino’s overall control.
Interpretation and Conclusions
Lycopodium’s conclusion was that the Twin Hills Gold Project PFS is a low technical risk conventional open pit mine and carbon-in-leach processing facility with a flowsheet which is based on unit operations that are proven in industry.
An economic analysis of the mine schedule generated from the PFS resource model has shown financial viability of the project at a gold price of US$1700/oz, and the sensitivity analysis has demonstrated continued profitability against changes in key project parameters at different gold prices.
A review of the outcomes of the PFS analysis indicates that the project is robust and has no fatal flaws, and it is therefore recommended that the project is progressed to the feasibility study level.
Figure 12: Twin Hills Gold Project Process Plant Flow Diagram
https://www.globenewswire.com/NewsRoom/AttachmentNg/40179ac9-5f3e-4a48-9d14-e0932bc9b645
Figure 13: Twin Hills Gold Project: Process Plant General Arrangement Plan
https://www.globenewswire.com/NewsRoom/AttachmentNg/cad60576-27a1-4b8d-80a2-573cfab27c21
Figure 14: Preliminary Site Layout
https://www.globenewswire.com/NewsRoom/AttachmentNg/61c595ab-f13a-4ab6-867d-bbed2e2d5a4b
Figure 15: Isometric View of Site Layout incl. Processing Plant, Tailings Storage Facility, Open Pits and Waste Dumps
https://www.globenewswire.com/NewsRoom/AttachmentNg/45c8e6f6-c66f-4aa2-bc95-09340aca3abf
Figure 16: Life of Mine Production Schedule
https://www.globenewswire.com/NewsRoom/AttachmentNg/335c8fac-decd-4d51-8378-eb77e92659a4
Qualified Persons & Technical Report
The qualified persons within the meaning of NI 43-101 who will prepare the technical report on the PFS in accordance with the disclosure and reporting requirements of NI 43-101 consists of Anton Geldenhuys, MGSSA PrSciNat, Principal Resource Consultant, CSA Global South Africa (Pty) Ltd. as to resource estimates; Glenn Bezuidenhout, Nat Dip (Ex Met), FSAIMM, Senior Process Consultant, Lycopodium Minerals Canada Ltd. as to metallurgy; Mr. Werner Moeller, MAusIMM, Director and Principal Mining Engineering Consultant, Qubeka Mining Consultants CC as to mining; Georgi Doundarov, M.Sc., P.Eng., PMP, CCP, Lycopodium Minerals Canada Ltd. as to economic evaluation; and Diana Duthe, M.Sc., PrSciNat, Lead Hydrogeologist, Knight Piesold Consulting as to hydrogeology. Mr. Geldenhuys, Mr. Bezuidenhout, Mr. Moeller, Mr. Doundarov, and Ms. Duthe are qualified persons who are independent of Osino under NI 43-101. The scientific and technical information contained in this news release has been reviewed and approved by Mr. Geldenhuys, Mr. Bezuidenhout, Mr. Moeller, Mr. Doundarov, and Ms. Duthe in their respective areas of expertise.
Anton Geldenhuys
Mr. Anton Geldenhuys is a Principal Consultant of CSA Global South Africa (Pty) Ltd. and holds a BSc (Hons) Geology degree from Rand Afrikaans University (South Africa) and an MEng from the University of the Witwatersrand (South Africa). He is a member in good standing of the Geological Society of South Africa and a registered Professional Natural Scientist (PrSciNat) with the South African Council for Natural Scientific Professions (SACNASP, membership number 400313/04). He has over 20 years' continuous professional experience in exploration, mineral resource development, and evaluation of mining projects. He is familiar with Ni 43-101 and, by reason of his education, experience and professional registrations, he fulfils the requirements of a Qualified Person as defined in NI 43-101. He has reviewed and approved the scientific and technical information in this news release related to mineral resources.
Glenn Bezuidenhout
Mr. Glenn Bezuidenhout is a Senior Process Consultant of Lycopodium Minerals Canada Ltd. He graduated from Witwatersrand Technicon of Johannesburg, South Africa with a National Diploma in Extractive Metallurgy (1979). He is a Fellow Member in good standing of the South Africa Institute of Mining and Metallurgy (FSAIMM nr. 705704). He has practised continuously as an engineer since 1979 and has 29 years' experience as an engineer on 18 mineral processing and mining projects and 13 years of mining operations experience, including experience at mines and mineral processing operations in South Africa, central and west Africa, and Namibia. He is familiar with Ni 43-101 and, by reason of his education, experience and professional registrations, he fulfils the requirements of a Qualified Person as defined in NI 43-101. He has reviewed and approved the scientific and technical information in this news release related to mineral processing and metallurgical testing.
Werner Moeller
Mr. Werner Moeller is a Director and Principal Mining Engineering Consultant of Qubeka Mining Consultants CC based in Windhoek, Namibia. He holds a BEng degree in Mining Engineering and a BEng (Hons) degree in Industrial Engineering from the University of Pretoria (South Africa). He is a Fellow of the Australian Institute of Mining and Metallurgy (membership number 329888) and a Member of the South African Institute of Mining and Metallurgy (membership number 704793). Mr Moeller has been practicing his profession continuously since 2002 and has twenty years of mine planning and operations experience across a range of African projects. He is familiar with NI 43-101 and, by reason of education, experience in exploration, mineral resource development, estimation and reporting of ore reserves, evaluation of mining projects and professional registration, he fulfils the requirements of a Qualified Person as defined in NI 43-101. He has been involved with the Project since September 2020 and has reviewed and approved the scientific and technical information in this news release related to Mining.
Georgi Doundarov
Mr. Georgi Doundarov is Senior Study Manager of Lycopodium Minerals Canada Ltd. based in Mississauga, Canada. He holds a M.Eng. degree in Infrastructure Management and Metallurgy (2005) from Yokohama National University, a MSc degree in Mineral Processing and Metallurgy (1996) and a BSc degree in Mineral Processing (1995) from University of Mining and Geology in Sofia, Bulgaria. He is a member in good standing with the Professional Engineers Ontario (P.Eng. nr. 100107167), Project Management Institute (Project Management Professional nr. 1218345), and the Association for Advancement of Cost Engineering International (Certified Cost Professional nr. 42319). Mr. Doundarov has practised as an engineer continuously since 1996 and has over 28 years managerial, operations, technical, project, and financial engineering experience globally in mining, mineral processing and metallurgy. He is familiar with Ni 43-101 and, by reason of his education, experience and professional registrations, he fulfils the requirements of a Qualified Person as defined in NI 43-101. He has reviewed and approved the scientific and technical information in this news release related to economic evaluation.
Diana Duthe
Ms. Diana Duthe is Lead Hydrogeologist of Knight Piesold Consulting based in Sandton, South Africa. She holds a BSc (Hons) degree in Geology (1985) from the University of Witwatersrand, South Africa and a MSc degree in Hydrogeology (1991) from the University of Neuchatel, Switzerland. She is a member in good standing of the Professional Registration of South African Council for Natural Scientific Professions (PrSciNat nr. 400091/01) and the Groundwater Section of the South African Geological Society. Ms. Duthe has practised as a scientist continuously since 1985 with over 30 years of consulting experience in the field of geology, geochemistry, and hydrogeology. She is familiar with NI 43-101 and, by reason of her education, experience and professional registrations, she fulfils the requirements of a Qualified Person as defined in NI 43-101. She has reviewed and approved the scientific and technical information in this news release related to hydrogeology.
Technical Disclosure
Data verification programs have included review of QA/QC data, re-sampling and sample analysis programs, and database verification. Verification checks have been performed on data, and comprise checks on surveys, collar coordinates and assay data. In the opinion of Mr. Geldenhuys, sufficient verification checks have been undertaken on the databases to provide confidence that the database is virtually error free and appropriate to support resource and reserve estimation.
David Underwood
Mr. David Underwood, BSc. (Hons) is Vice President Exploration of Osino Resources Corp. and has reviewed and approved the scientific and technical information in this news release related to geology and exploration. He is a registered Professional Natural Scientist with the South African Council for Natural Scientific Professions (Pr. Sci. Nat. No.400323/11) and a Qualified Person for the purposes of National Instrument 43-101.
About Lycopodium
Lycopodium is an innovative and value-driven process, engineering and project delivery organisation with extensive African experience. The Company is headquartered in Perth, Western Australia and is listed on the Australian Stock Exchange (ASX: LYL) and with its global offices and international network, Lycopodium is able to offer its clients professional services for Feasibility Studies, Process Development and Optimisation, Engineering and Design, Project Management and Delivery, Project Services, Construction Management, Completions, and Commissioning and Operations Support including Asset Management.
Presentation & Investor Webinar
Osino will host an investor webinar to discuss the PFS today, Tuesday, September 6 at 8am PDT / 11am EDT. Shareholders, analysts, investors and media are invited to join the live webcast by registering using the following link: https://attendee.gotowebinar.com/register/2347595189721541904.
After registering, you will receive a confirmation email containing details to access the webinar via conference call or webcast. The replay will also be available on Osino’s website.
A presentation to accompany the webinar will be available on the Company’s website.
About Osino Resources
Osino is a Canadian gold exploration and development company focused on the fast-tracked development of our Twin Hills Gold Project (“Twin Hills”) in central Namibia. Twin Hills is at an advanced stage of exploration and development with more than 220,000m of drilling completed on the project since its grassroots discovery by Osino with various advanced development studies underway.
Osino has a large ground position of approximately 6,900km2 located within Namibia’s prospective Damara sedimentary mineral belt, mostly in proximity to and along strike of the producing Navachab and Otjikoto Gold Mines. The Company is actively exploring a range of gold prospects and targets along the belt by utilizing a portfolio approach geared towards discovery, targeting gold mineralization that fits the broad orogenic gold model.
Our core projects are favorably located north and north-west of Namibia’s capital city Windhoek. By virtue of their location, the projects benefit significantly from Namibia’s well-established infrastructure with paved highways, railway, power and water in close proximity. Namibia is mining-friendly and lauded as one of the continent’s most politically and socially stable jurisdictions. Osino continues to evaluate new ground with a view to expanding our Namibian portfolio.
Further details are available on the Company's website at https://osinoresources.com/
On Behalf of The Board of Directors
"Heye Daun"
Heye Daun
Chief Executive Officer, President, and Director
CONTACT INFORMATION
Osino Resources Corp.
Julia Becker: Investor Relations Manager
Tel: +1 (604) 785 0850
jbecker@osinoresources.com
Neither the TSX Venture Exchange nor its Regulation Services Provider (as that term is defined in the policies of the TSX Venture Exchange) accepts responsibility for the adequacy or accuracy of this press release.
Cautionary Statement Regarding Forward-Looking Information
Certain information set forth in this news release contains “forward‐looking statements” and “forward‐looking information” within the meaning of applicable Canadian securities legislation (referred to herein as forward‐looking statements) and in applicated United States securities law. Except for statements of historical fact, certain information contained herein constitutes forward‐looking statements which includes, but is not limited to, statements with respect to: the future financial or operating performance of the Company and its Twin Hills Gold Project; results from work performed to date; the estimation of mineral resources and reserves; the realization of mineral resource and reserve estimates; the development, operational and economic results of the preliminary feasibility study (the “PFS”) for the Twin Hills Gold Project (the “Project”), including cash flows, revenue potential, staged development, capital expenditures, development costs and timing thereof, extraction rates, life of mine projections and cost estimates; timing of completion of a technical report summarizing the results of the PFS; magnitude or quality of mineral deposits; anticipated advancement of the Project mine plan; exploration expenditures, costs and timing of the development of new deposits; costs and timing of future exploration; the completion and timing of future development studies; estimates of metallurgical recovery rates; anticipated advancement of the Project and future exploration prospects; requirements for additional capital; the future price of metals; government regulation of mining operations; environmental risks; the timing and possible outcome of pending regulatory matters; the realization of the expected economics of the Project; future growth potential of the Project; and future development plans. Forward-looking statements are often identified by the use of words such as “may”, “will”, “could”, “would”, “anticipate”, ‘believe”, expect”, “intend”, “potential”, “estimate”, “budget”, “scheduled”, “plans”, “planned”, “forecasts”, “goals” and similar expressions. Forward-looking statements are based on a number of factors and assumptions made by management and considered reasonable at the time such information is provided. Assumptions and factors include: the Company’s ability to complete its planned exploration programs; the absence of adverse conditions at the Project; no unforeseen operational delays; no material delays in obtaining necessary permits; the price of gold remaining at levels that render the Project economic; the Company’s ability to continue raising necessary capital to finance operations; and the ability to realize on the mineral resource and reserve estimates. Forward‐looking statements necessarily involve known and unknown risks and uncertainties, which may cause actual performance and financial results in future periods to differ materially from any projections of future performance or result expressed or implied by such forward‐looking statements. These risks and uncertainties include, but are not limited to: general business, economic and competitive uncertainties; the actual results of current and future exploration activities; conclusions of economic evaluations; meeting various expected cost estimates; benefits of certain technology usage; changes in project parameters or economic assessments as plans continue to be refined; future prices of metals and foreign exchange rates; possible variations of mineral grade or recovery rates; the risk that actual costs may exceed estimated costs; geological, mining and exploration technical problems; failure of plant, equipment or processes to operate as anticipated; accidents, labour disputes and other risks of the mining industry; delays in obtaining governmental approvals or financing; the speculative nature of mineral exploration and development (including the risks of obtaining necessary licenses, permits and approvals from government authorities); title to properties; the impact of COVID-19 on the timing of exploration and development work and management’s ability to anticipate and manage the foregoing factors and risks. Although the Company has attempted to identify important factors that could cause actual actions, events or results to differ materially from those described in the forward-looking statements, there may be other factors that cause actions, events or results not to be as anticipated, estimated or intended. Readers are advised to study and consider risk factors disclosed in the Company’s most recently filed annual information form or management's discussion and analysis filed on SEDAR under the Company's profile at www.sedar.com.
There can be no assurance that forward‐looking statements will prove to be accurate, as actual results and future events could differ materially from those anticipated in such statements. The Company undertakes no obligation to update forward‐looking statements if circumstances or management’s estimates or opinions should change except as required by applicable securities laws. The forward-looking statements contained herein is presented for the purposes of assisting in understanding the Company’s plan, objectives and goals and may not be appropriate for other purposes. Forward-looking statements are not guarantees of future performance and readers are cautioned not to place undue reliance on forward‐looking statements. This presentation also contains or references certain market, industry and peer group data which is based upon information from independent industry publications, market research, analyst reports and surveys and other publicly available sources. Although the Company believes these sources to be generally reliable, such information is subject to interpretation and cannot be verified with complete certainty due to limits on the availability and reliability of raw data, the voluntary nature of the data gathering process and other inherent limitations and uncertainties. The Company has not independently verified any of the data from third party sources referred to in this news release and accordingly, the accuracy and completeness of such data is not guaranteed.
(Not for dissemination in the United States of America.)


Figure 1
Post-Tax Project NPV Sensitivity to Variations in Key Project Parameters at US$1700/oz
Figure 2
Plan view showing mineralized material in the US$1800/oz reporting pit shell above 0.3 g/t Au
Figure 3
Design, Layout and Location of Process Plant, Pit and Waste Rock Dumps
Figure 4
Design, Layout and Location of Process Plant, Pit and Waste Rock Dumps
Figure 5
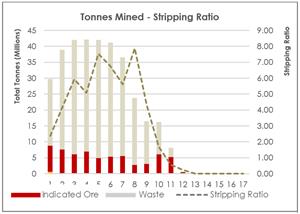
Stripping Ratio
Figure 6
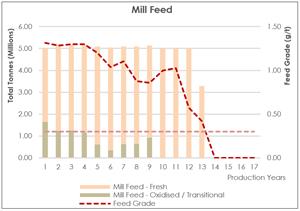
Mill Feed
Figure 7
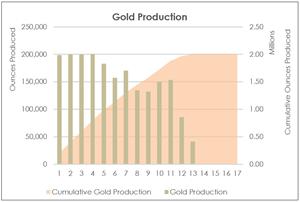
Gold Production
Figure 8
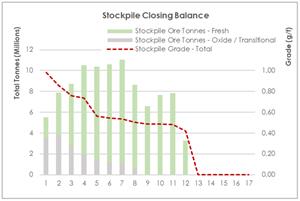
Stockpile Schedules
Figure 9

Schematic Process Plant Layout
Figure 10
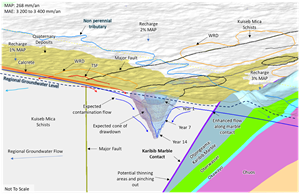
Conceptual Hydrogeological Model for Twin Hills
Figure 11
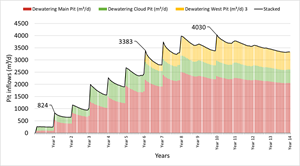
Life-of-Mine Pit Dewatering Inflow Calculations
Figure 12
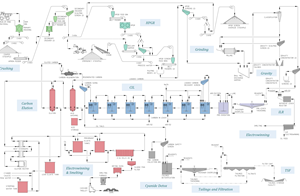
Twin Hills Gold Project Process Plant Flow Diagram
Figure 13
Twin Hills Gold Project: Process Plant General Arrangement Plan
Figure 14
Preliminary Site Layout
Figure 15
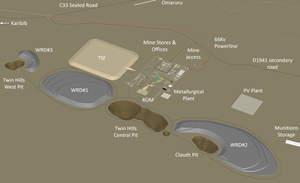
Isometric View of Site Layout incl. Processing Plant, Tailings Storage Facility, Open Pits and Waste Dumps
Figure 16